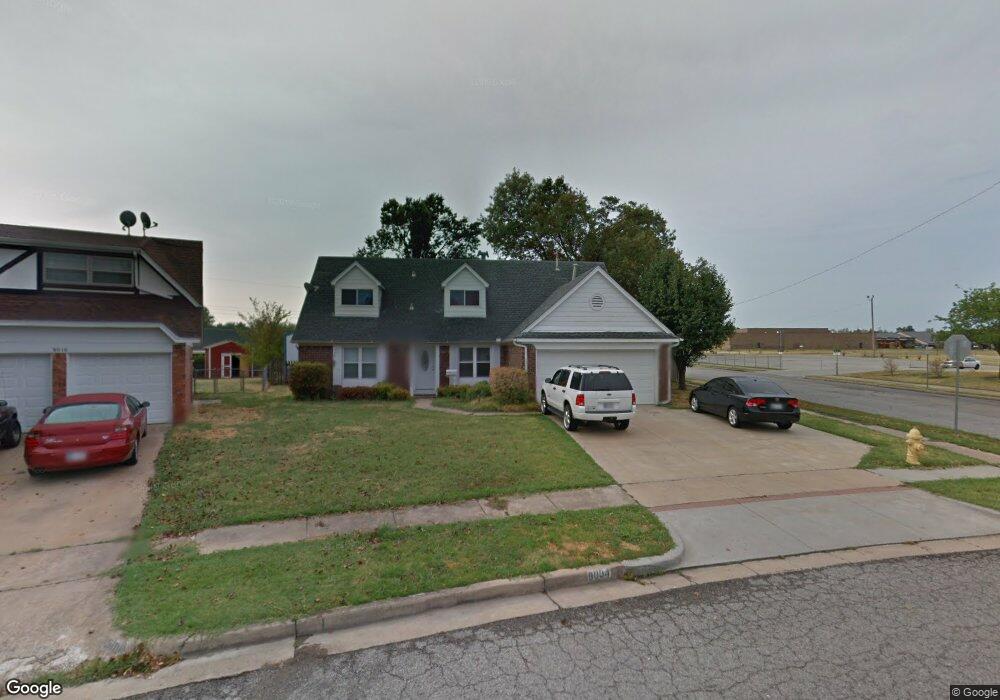
9004 E 28th St Tulsa, OK 74129
Audubon NeighborhoodEstimated Value: $218,696 - $268,000
4
Beds
2
Baths
1,967
Sq Ft
$125/Sq Ft
Est. Value
About This Home
This home is located at 9004 E 28th St, Tulsa, OK 74129 and is currently estimated at $246,174, approximately $125 per square foot. 9004 E 28th St is a home located in Tulsa County with nearby schools including Skelly Elementary School, Nathan Hale High School, and College Bound Academy.
Ownership History
Date
Name
Owned For
Owner Type
Purchase Details
Closed on
Oct 29, 2010
Sold by
Youman Jonathan C and Youman Kari E
Bought by
Vang Neng and Vang Tou G
Current Estimated Value
Home Financials for this Owner
Home Financials are based on the most recent Mortgage that was taken out on this home.
Original Mortgage
$121,831
Outstanding Balance
$79,641
Interest Rate
4.32%
Mortgage Type
FHA
Estimated Equity
$166,533
Purchase Details
Closed on
Mar 16, 2006
Sold by
Lawrence Rickey Glenn and Lawrence Candy Jean
Bought by
Youman Jonathan C and Youman Karl E
Home Financials for this Owner
Home Financials are based on the most recent Mortgage that was taken out on this home.
Original Mortgage
$116,166
Interest Rate
6.24%
Mortgage Type
FHA
Purchase Details
Closed on
Jan 17, 2002
Sold by
Cottrill Stuart G and Cottrill Lynne Marie
Bought by
Lawrence Rickey Glenn and Lawrence Candy Jean
Purchase Details
Closed on
Oct 1, 1985
Create a Home Valuation Report for This Property
The Home Valuation Report is an in-depth analysis detailing your home's value as well as a comparison with similar homes in the area
Home Values in the Area
Average Home Value in this Area
Purchase History
| Date | Buyer | Sale Price | Title Company |
|---|---|---|---|
| Vang Neng | $125,000 | Executives Title & Escrow Co | |
| Youman Jonathan C | $118,000 | First American Title & Abstr | |
| Lawrence Rickey Glenn | $105,000 | Firstitle & Abstract Svcs In | |
| -- | $60,000 | -- |
Source: Public Records
Mortgage History
| Date | Status | Borrower | Loan Amount |
|---|---|---|---|
| Open | Vang Neng | $121,831 | |
| Previous Owner | Youman Jonathan C | $116,166 |
Source: Public Records
Tax History
| Year | Tax Paid | Tax Assessment Tax Assessment Total Assessment is a certain percentage of the fair market value that is determined by local assessors to be the total taxable value of land and additions on the property. | Land | Improvement |
|---|---|---|---|---|
| 2025 | $2,240 | $16,713 | $2,047 | $14,666 |
| 2024 | $1,924 | $15,917 | $2,257 | $13,660 |
| 2023 | $1,924 | $15,159 | $2,392 | $12,767 |
| 2022 | $1,925 | $14,437 | $2,506 | $11,931 |
| 2021 | $1,816 | $13,750 | $2,387 | $11,363 |
| 2020 | $1,791 | $13,750 | $2,387 | $11,363 |
| 2019 | $1,884 | $13,750 | $2,387 | $11,363 |
| 2018 | $1,888 | $13,750 | $2,387 | $11,363 |
| 2017 | $1,885 | $13,750 | $2,387 | $11,363 |
| 2016 | $1,846 | $13,750 | $2,387 | $11,363 |
| 2015 | $1,850 | $13,750 | $2,387 | $11,363 |
| 2014 | $1,832 | $13,750 | $2,387 | $11,363 |
Source: Public Records
Map
Nearby Homes
- 9007 E 29th Ct
- 2813 S 88th East Ave
- 9057 E 33rd St
- 9615 E 27th St
- 9815 E 29th St
- 3329 S 93rd East Ave
- 3100 S 101st East Ave
- 7927 E 26th
- 3401 S 93rd East Ave
- 3146 S 101st East Ave Unit 1201
- 10108 E 28th St
- 8109 E 31st Place
- 7925 E 27th Ct
- 9522 E 36th St
- 7923 E 26th Place
- 2313 S 82nd East Ave
- 2227 S 83rd East Ave
- 10214 E 24th St
- 10114 E 23rd St
- 2618 S 79th East Ave
- 9010 E 28th St
- 9015 E 29th St
- 9021 E 29th St
- 2821 S 90th East Ave
- 2821 E 90th St Unit 3
- 2821 E 90th St Unit 11/3
- 2821 E 90th St Unit 11
- 9014 E 28th St
- 9027 E 29th St
- 9009 E 28th St
- 9033 E 29th St
- 9020 E 28th St
- 9015 E 28th St
- 9037 E 29th St
- 9011 E 29th Place
- 2834 S 90th East Ave Unit 1804
- 9026 E 28th St
- 9021 E 28th St
- 9012 E 29th St
- 2911 S 90th East Ave
Your Personal Tour Guide
Ask me questions while you tour the home.