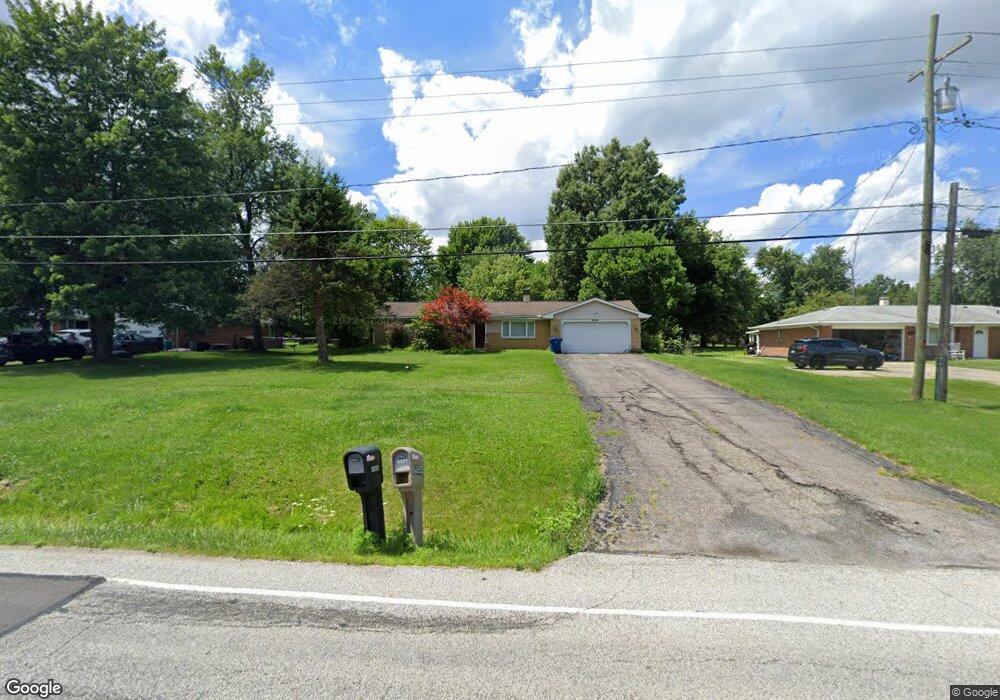
9004 N Bedford Rd MacEdonia, OH 44056
Estimated Value: $241,636 - $282,000
3
Beds
2
Baths
1,246
Sq Ft
$214/Sq Ft
Est. Value
About This Home
This home is located at 9004 N Bedford Rd, MacEdonia, OH 44056 and is currently estimated at $266,159, approximately $213 per square foot. 9004 N Bedford Rd is a home located in Summit County with nearby schools including Lee Eaton Elementary School, Nordonia Middle School, and Nordonia High School.
Ownership History
Date
Name
Owned For
Owner Type
Purchase Details
Closed on
Jul 26, 2006
Sold by
Boger Brian L and Boger Audra L
Bought by
Hillen Denise L
Current Estimated Value
Home Financials for this Owner
Home Financials are based on the most recent Mortgage that was taken out on this home.
Original Mortgage
$138,400
Outstanding Balance
$82,958
Interest Rate
6.73%
Mortgage Type
Purchase Money Mortgage
Estimated Equity
$183,201
Purchase Details
Closed on
Oct 22, 2001
Sold by
Testa Denise M
Bought by
Boger Brian L and Boger Audra L
Home Financials for this Owner
Home Financials are based on the most recent Mortgage that was taken out on this home.
Original Mortgage
$142,513
Interest Rate
6.88%
Mortgage Type
FHA
Purchase Details
Closed on
Jun 23, 1997
Sold by
Zuccaro Mark R
Bought by
Testa Denise M
Home Financials for this Owner
Home Financials are based on the most recent Mortgage that was taken out on this home.
Original Mortgage
$116,600
Interest Rate
8.01%
Mortgage Type
FHA
Create a Home Valuation Report for This Property
The Home Valuation Report is an in-depth analysis detailing your home's value as well as a comparison with similar homes in the area
Home Values in the Area
Average Home Value in this Area
Purchase History
| Date | Buyer | Sale Price | Title Company |
|---|---|---|---|
| Hillen Denise L | $173,000 | First American Title Ins Co | |
| Boger Brian L | $145,000 | Midland Commerce Group | |
| Testa Denise M | $117,000 | -- |
Source: Public Records
Mortgage History
| Date | Status | Borrower | Loan Amount |
|---|---|---|---|
| Open | Hillen Denise L | $138,400 | |
| Previous Owner | Boger Brian L | $142,513 | |
| Previous Owner | Testa Denise M | $116,600 |
Source: Public Records
Tax History Compared to Growth
Tax History
| Year | Tax Paid | Tax Assessment Tax Assessment Total Assessment is a certain percentage of the fair market value that is determined by local assessors to be the total taxable value of land and additions on the property. | Land | Improvement |
|---|---|---|---|---|
| 2025 | $3,339 | $74,627 | $12,369 | $62,258 |
| 2024 | $3,339 | $74,627 | $12,369 | $62,258 |
| 2023 | $3,339 | $74,627 | $12,369 | $62,258 |
| 2022 | $2,950 | $53,796 | $8,901 | $44,895 |
| 2021 | $2,959 | $53,796 | $8,901 | $44,895 |
| 2020 | $2,905 | $53,800 | $8,900 | $44,900 |
| 2019 | $3,809 | $56,840 | $8,900 | $47,940 |
| 2018 | $3,766 | $56,840 | $8,900 | $47,940 |
| 2017 | $3,433 | $56,840 | $8,900 | $47,940 |
| 2016 | $3,707 | $51,990 | $8,900 | $43,090 |
| 2015 | $3,433 | $51,990 | $8,900 | $43,090 |
| 2014 | $2,850 | $51,990 | $8,900 | $43,090 |
| 2013 | $2,976 | $54,840 | $8,900 | $45,940 |
Source: Public Records
Map
Nearby Homes
- 9081 N Bedford Rd
- 9109 Seminole Ln
- 698 Ledge Rd
- 615 Ledge Rd
- 300 Kelley Dr
- 307 Eagleton Ct Unit 20
- 321 Hartsfield Terrace
- 1149 Brookpoint Dr
- 9158 Tanglewood Rd
- 8605 Strawbridge Cir
- 8602 Strawbridge Cir
- 8542 Mandell Dr
- 1227 Shepard Hills Blvd
- 1992 Heron Glen Ct
- 9435 Airlane Dr
- 8282 Fairlane Dr
- V/L Meadow Ln
- 9083 Shepard Rd
- 9571 Shepard Rd
- 9207 N Plaza Dr
- 9014 N Bedford Rd
- 8994 N Bedford Rd
- 8957 Starlight Dr
- 9024 N Bedford Rd
- 8967 Starlight Dr
- 8947 Starlight Dr
- 8976 N Bedford Rd
- 8993 N Bedford Rd
- 8983 N Bedford Rd
- 8973 N Bedford Rd
- 8979 Starlight Dr
- 8937 Starlight Dr
- 9003 N Bedford Rd
- 8964 N Bedford Rd
- 8963 N Bedford Rd
- 9013 N Bedford Rd
- 8925 Starlight Dr
- 9042 N Bedford Rd
- 639 Lacross Dr
- 9023 N Bedford Rd