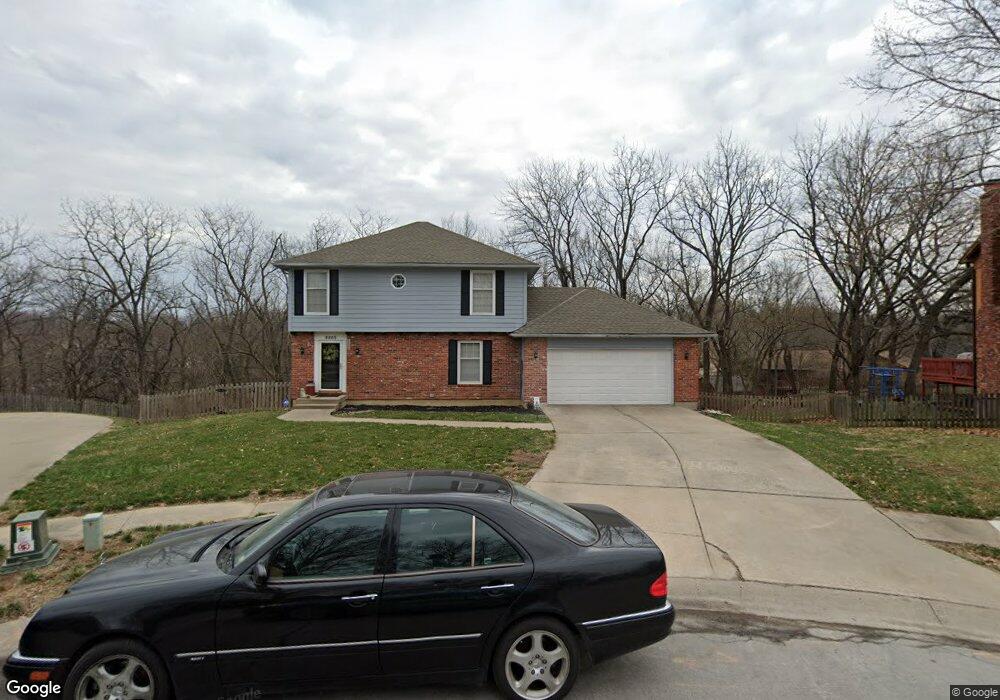
9005 Evanston Ct Kansas City, MO 64138
White Oak NeighborhoodEstimated Value: $268,000 - $329,443
3
Beds
3
Baths
1,946
Sq Ft
$154/Sq Ft
Est. Value
About This Home
This home is located at 9005 Evanston Ct, Kansas City, MO 64138 and is currently estimated at $299,111, approximately $153 per square foot. 9005 Evanston Ct is a home located in Jackson County with nearby schools including Truman Elementary School, Carver Christian Academy, and St Regis School.
Ownership History
Date
Name
Owned For
Owner Type
Purchase Details
Closed on
Jul 18, 2001
Sold by
Stevenson Donald William and Stevenson Donald
Bought by
Stevenson Donald William and Stevenson Mildred J
Current Estimated Value
Home Financials for this Owner
Home Financials are based on the most recent Mortgage that was taken out on this home.
Original Mortgage
$127,000
Outstanding Balance
$49,085
Interest Rate
7.18%
Mortgage Type
Purchase Money Mortgage
Estimated Equity
$250,026
Purchase Details
Closed on
Sep 15, 1997
Sold by
Henderson Brenda P L and Benefield Gert
Bought by
Stevenson Donald
Home Financials for this Owner
Home Financials are based on the most recent Mortgage that was taken out on this home.
Original Mortgage
$103,500
Interest Rate
7.49%
Mortgage Type
Purchase Money Mortgage
Purchase Details
Closed on
Jan 24, 1997
Sold by
Henderson Gary W
Bought by
Hilson Brenda P
Create a Home Valuation Report for This Property
The Home Valuation Report is an in-depth analysis detailing your home's value as well as a comparison with similar homes in the area
Home Values in the Area
Average Home Value in this Area
Purchase History
| Date | Buyer | Sale Price | Title Company |
|---|---|---|---|
| Stevenson Donald William | -- | First American Title Ins | |
| Stevenson Donald | -- | Stewart Title | |
| Hilson Brenda P | -- | -- |
Source: Public Records
Mortgage History
| Date | Status | Borrower | Loan Amount |
|---|---|---|---|
| Open | Stevenson Donald William | $127,000 | |
| Closed | Stevenson Donald | $103,500 |
Source: Public Records
Tax History Compared to Growth
Tax History
| Year | Tax Paid | Tax Assessment Tax Assessment Total Assessment is a certain percentage of the fair market value that is determined by local assessors to be the total taxable value of land and additions on the property. | Land | Improvement |
|---|---|---|---|---|
| 2025 | $4,216 | $46,486 | $5,685 | $40,801 |
| 2024 | $4,216 | $48,705 | $8,964 | $39,741 |
| 2023 | $4,140 | $48,704 | $6,965 | $41,739 |
| 2022 | $3,481 | $35,150 | $7,220 | $27,930 |
| 2021 | $3,002 | $35,150 | $7,220 | $27,930 |
| 2020 | $3,029 | $33,521 | $7,220 | $26,301 |
| 2019 | $2,865 | $33,521 | $7,220 | $26,301 |
| 2018 | $2,565 | $28,028 | $3,552 | $24,476 |
| 2017 | $2,565 | $28,028 | $3,552 | $24,476 |
| 2016 | $2,575 | $27,326 | $3,848 | $23,478 |
| 2014 | $2,497 | $26,790 | $3,772 | $23,018 |
Source: Public Records
Map
Nearby Homes
- 9425 E 90th Terrace
- 8618 Arlington Ave
- 9109 E 89th St
- 9033 E 90th Terrace
- 8529 Crescent Ave
- 9201 E 87th St
- 9901 E 85th St
- 8512 Maywood Ave
- 8421 Hawthorne Place
- 9006 Tennessee Ave
- 8925 E 89th St
- 9334 E 85th St
- 8916 E 89th Terrace
- 10500 E Bannister Rd
- 9420 Ralston Ave
- 10001 E 84th St
- 8617 Lane Ave
- 9525 Manning Ave
- 9012 E 85th Terrace
- 8400 Willow Way
- 9009 Evanston Ct
- 9001 Evanston Ct
- 9000 Evanston Ct
- 9004 Evanston Ct
- 9013 Evanston Ct
- 9800 E 90th Terrace
- 9706 E 90th Terrace
- 9008 Evanston Ct
- 9710 E 90th Terrace
- 9017 Evanston Ct
- 9012 Evanston Ct
- 9700 E 90th Terrace
- 9016 Evanston Ct
- 9804 E 90th Terrace
- 9020 Evanston Ct
- 9808 E 90th Terrace
- 9709 E 90th Terrace
- 9801 E 90th Terrace
- 9024 Evanston Ct
- 9701 E 90th Terrace