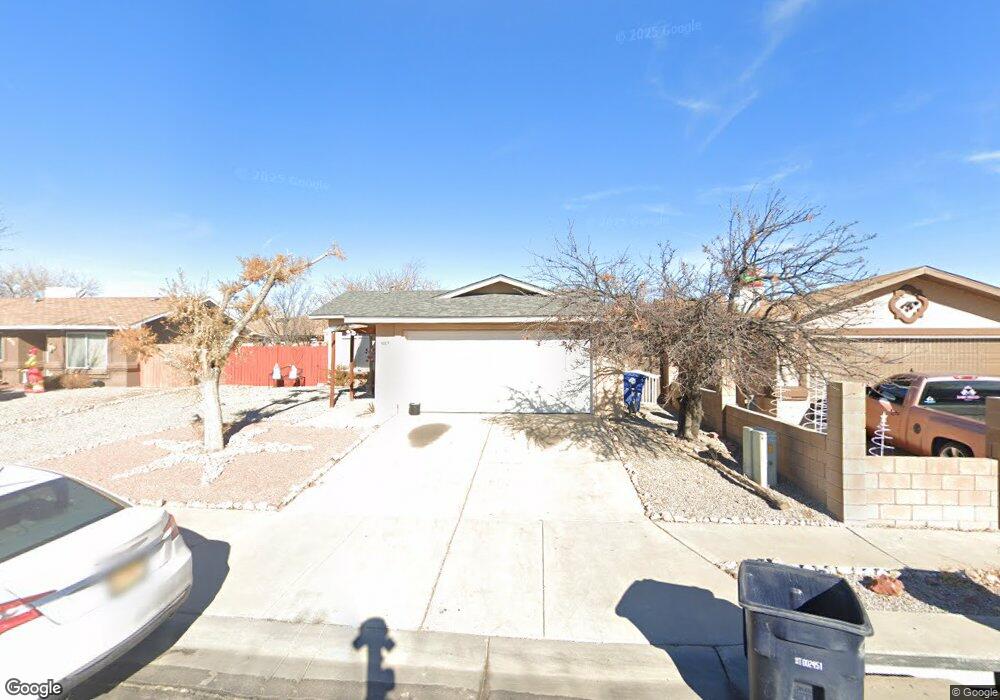
9005 Sunwise Ave SW Albuquerque, NM 87121
Southwest Heights NeighborhoodEstimated Value: $225,000 - $282,000
3
Beds
2
Baths
1,193
Sq Ft
$219/Sq Ft
Est. Value
About This Home
This home is located at 9005 Sunwise Ave SW, Albuquerque, NM 87121 and is currently estimated at $261,290, approximately $219 per square foot. 9005 Sunwise Ave SW is a home located in Bernalillo County with nearby schools including Helen Cordero Primary School, Edward Gonzales Elementary School, and Truman Middle School.
Ownership History
Date
Name
Owned For
Owner Type
Purchase Details
Closed on
Mar 3, 2008
Sold by
Perea Felisha
Bought by
Lozano Virginia
Current Estimated Value
Home Financials for this Owner
Home Financials are based on the most recent Mortgage that was taken out on this home.
Original Mortgage
$116,000
Outstanding Balance
$72,033
Interest Rate
5.68%
Mortgage Type
Purchase Money Mortgage
Estimated Equity
$189,257
Purchase Details
Closed on
Mar 6, 2006
Sold by
Gomez Genevieve J and Gomez Joaquin
Bought by
Perea Felisha
Home Financials for this Owner
Home Financials are based on the most recent Mortgage that was taken out on this home.
Original Mortgage
$117,500
Interest Rate
6.05%
Mortgage Type
Fannie Mae Freddie Mac
Purchase Details
Closed on
May 8, 2000
Sold by
Hill Joseph T and Hill Erminia J
Bought by
Gomez Joaquin and Gomez Genevieve J
Home Financials for this Owner
Home Financials are based on the most recent Mortgage that was taken out on this home.
Original Mortgage
$65,250
Interest Rate
8.18%
Create a Home Valuation Report for This Property
The Home Valuation Report is an in-depth analysis detailing your home's value as well as a comparison with similar homes in the area
Home Values in the Area
Average Home Value in this Area
Purchase History
| Date | Buyer | Sale Price | Title Company |
|---|---|---|---|
| Lozano Virginia | -- | Stewart Title | |
| Perea Felisha | -- | First American Title Ins Co | |
| Gomez Joaquin | -- | First American Title Ins Co |
Source: Public Records
Mortgage History
| Date | Status | Borrower | Loan Amount |
|---|---|---|---|
| Open | Lozano Virginia | $116,000 | |
| Previous Owner | Perea Felisha | $117,500 | |
| Previous Owner | Gomez Joaquin | $65,250 |
Source: Public Records
Tax History Compared to Growth
Tax History
| Year | Tax Paid | Tax Assessment Tax Assessment Total Assessment is a certain percentage of the fair market value that is determined by local assessors to be the total taxable value of land and additions on the property. | Land | Improvement |
|---|---|---|---|---|
| 2024 | $979 | $40,223 | $13,914 | $26,309 |
| 2023 | $953 | $39,052 | $13,509 | $25,543 |
| 2022 | $1,613 | $37,915 | $13,116 | $24,799 |
| 2021 | $1,559 | $36,811 | $12,734 | $24,077 |
| 2020 | $1,533 | $35,739 | $12,363 | $23,376 |
| 2019 | $1,488 | $34,698 | $12,003 | $22,695 |
| 2018 | $1,435 | $34,698 | $12,003 | $22,695 |
| 2017 | $1,391 | $33,688 | $11,654 | $22,034 |
| 2016 | $1,351 | $31,756 | $10,986 | $20,770 |
| 2015 | $30,831 | $30,831 | $10,666 | $20,165 |
| 2014 | $1,309 | $30,831 | $10,666 | $20,165 |
| 2013 | -- | $31,064 | $10,666 | $20,398 |
Source: Public Records
Map
Nearby Homes
- 700 Lone Pine Dr SW
- 0 Sage & 90th St SW Unit 1083191
- 537 Sky Tower St SW
- 615 Avanti St SW
- 8523 Vista Serena Ln SW
- 9736 Westbound Ave SW
- 8709 Rhonda Ave SW
- 9608 Water Stone Rd SW
- 921 Roma Dora Ln
- 9900 Ladder Ranch Ln SW
- 8209 Bianca Ct SW
- 8930 Thor Rd SW
- 519 Fenwick Place SW
- 9300 Jenny Ave SW
- 9504 Sage Ranch Ct
- 615 82nd St SW
- 9508 Sage Ranch Ct SW
- 9931 Hideout Ln SW
- 9609 Sage Ranch Ct SW
- 805 Malachite Dr SW
- 9001 Sunwise Ave SW
- 9009 Sunwise Ave SW Unit IV
- 9004 Sunfish Ave SW
- 9000 Sunfish Ave SW
- 9015 Sunwise Ave SW
- 9008 Sunfish Ave SW
- 9004 Sunwise Ave SW
- 9012 Sunfish Ave SW
- 9000 Sunwise Ave SW
- 9008 Sunwise Ave SW
- 9101 Sunwise Ave SW
- 9012 Sunwise Ave SW
- 700 Sunbear Dr SW
- 704 Sunbear Dr SW
- 9100 Sunfish Ave SW
- 708 Sunbear Dr SW
- 9105 Sunwise Ave SW
- 624 Sunbear Dr SW
- 9005 Sundial Place SW
- 9005 Sunfish Ave SW