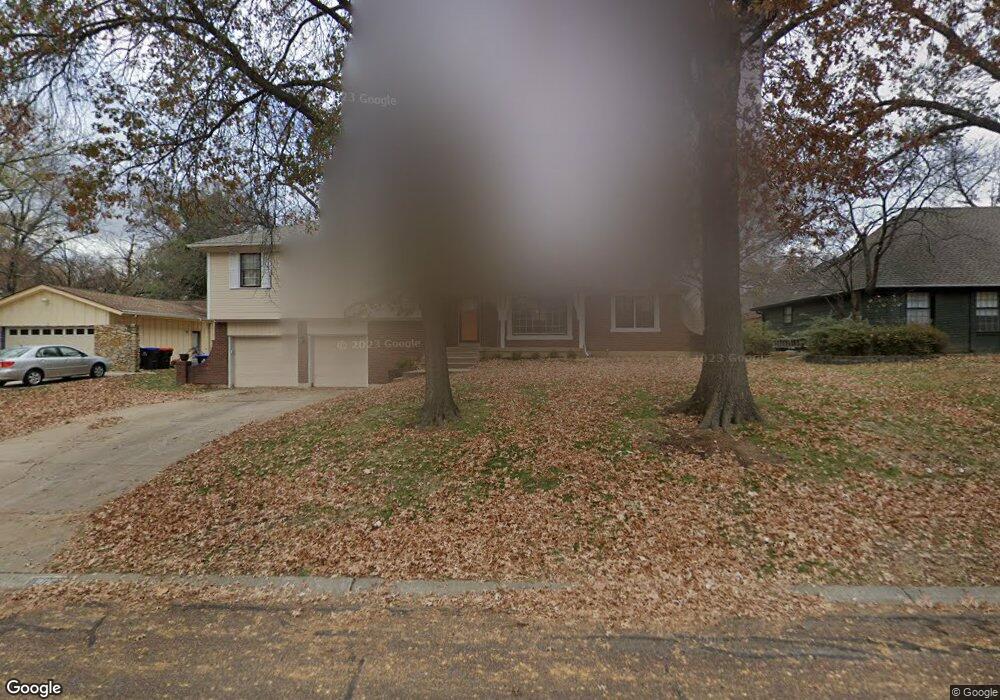
9006 W 106th St Overland Park, KS 66212
Oak Park NeighborhoodEstimated Value: $419,000 - $457,000
4
Beds
3
Baths
2,090
Sq Ft
$212/Sq Ft
Est. Value
About This Home
This home is located at 9006 W 106th St, Overland Park, KS 66212 and is currently estimated at $443,527, approximately $212 per square foot. 9006 W 106th St is a home located in Johnson County with nearby schools including Brookridge Elementary School, Shawnee Mission South High School, and Indian Woods Middle School.
Ownership History
Date
Name
Owned For
Owner Type
Purchase Details
Closed on
May 3, 2013
Sold by
Snyder William J and Snyder Wenda S
Bought by
Snyder William J and Snyder Wenda S
Current Estimated Value
Home Financials for this Owner
Home Financials are based on the most recent Mortgage that was taken out on this home.
Original Mortgage
$177,500
Outstanding Balance
$83,431
Interest Rate
3.61%
Mortgage Type
New Conventional
Estimated Equity
$360,096
Purchase Details
Closed on
Apr 24, 2009
Sold by
Federal National Mortgage Association
Bought by
Snyder William J
Home Financials for this Owner
Home Financials are based on the most recent Mortgage that was taken out on this home.
Original Mortgage
$183,811
Interest Rate
5.03%
Mortgage Type
FHA
Purchase Details
Closed on
Jun 10, 2008
Sold by
Sears Robert B
Bought by
Federal National Mortgage Association
Create a Home Valuation Report for This Property
The Home Valuation Report is an in-depth analysis detailing your home's value as well as a comparison with similar homes in the area
Home Values in the Area
Average Home Value in this Area
Purchase History
| Date | Buyer | Sale Price | Title Company |
|---|---|---|---|
| Snyder William J | -- | Truhome Title Solutions Llc | |
| Snyder William J | -- | Stewart Title | |
| Federal National Mortgage Association | $173,174 | None Available |
Source: Public Records
Mortgage History
| Date | Status | Borrower | Loan Amount |
|---|---|---|---|
| Open | Snyder William J | $177,500 | |
| Closed | Snyder William J | $183,811 |
Source: Public Records
Tax History Compared to Growth
Tax History
| Year | Tax Paid | Tax Assessment Tax Assessment Total Assessment is a certain percentage of the fair market value that is determined by local assessors to be the total taxable value of land and additions on the property. | Land | Improvement |
|---|---|---|---|---|
| 2024 | $3,897 | $40,434 | $9,355 | $31,079 |
| 2023 | $3,823 | $39,065 | $9,355 | $29,710 |
| 2022 | $3,451 | $35,535 | $8,501 | $27,034 |
| 2021 | $3,451 | $33,109 | $7,390 | $25,719 |
| 2020 | $3,174 | $31,119 | $5,682 | $25,437 |
| 2019 | $2,791 | $27,404 | $4,373 | $23,031 |
| 2018 | $2,660 | $26,013 | $4,373 | $21,640 |
| 2017 | $2,496 | $24,023 | $4,373 | $19,650 |
| 2016 | $2,470 | $23,379 | $4,373 | $19,006 |
| 2015 | $2,290 | $22,126 | $4,373 | $17,753 |
| 2013 | -- | $20,792 | $4,373 | $16,419 |
Source: Public Records
Map
Nearby Homes
- 8858 W 106th Terrace
- 8819 W 106th Terrace
- 9006 W 104th Terrace
- 9701 W 104th St
- 9805 W 104th Terrace
- 8607 W 108 Place
- 8635 W 109th St
- 11163 Eby St
- 9222 W 101st St
- 9206 W 100th St
- 9804 W 100th Terrace
- 10000 Knox Dr
- 8201 W 100th Terrace
- 8500 W 113th St
- 9912 Knox Dr
- 9831 Carter Dr
- 8812 W 98th Terrace
- 9921 Wedd Dr
- 8712 W 113th St
- 11404 Grandview Dr
- 9004 W 106th St
- 9008 W 106th St
- 9009 W 105th Terrace
- 9007 W 105th Terrace
- 9012 W 106th St
- 9000 W 106th St
- 9013 W 105th Terrace
- 9007 W 106th St
- 9003 W 105th Terrace
- 9009 W 106th St
- 9015 W 105th Terrace
- 8913 W 105th Terrace
- 9100 W 106th St
- 8912 W 106th St
- 9001 W 106th St
- 9013 W 106th St
- 9008 W 105th Terrace
- 9103 W 105th Terrace
- 9006 W 105th Terrace
- 9012 W 105th Terrace