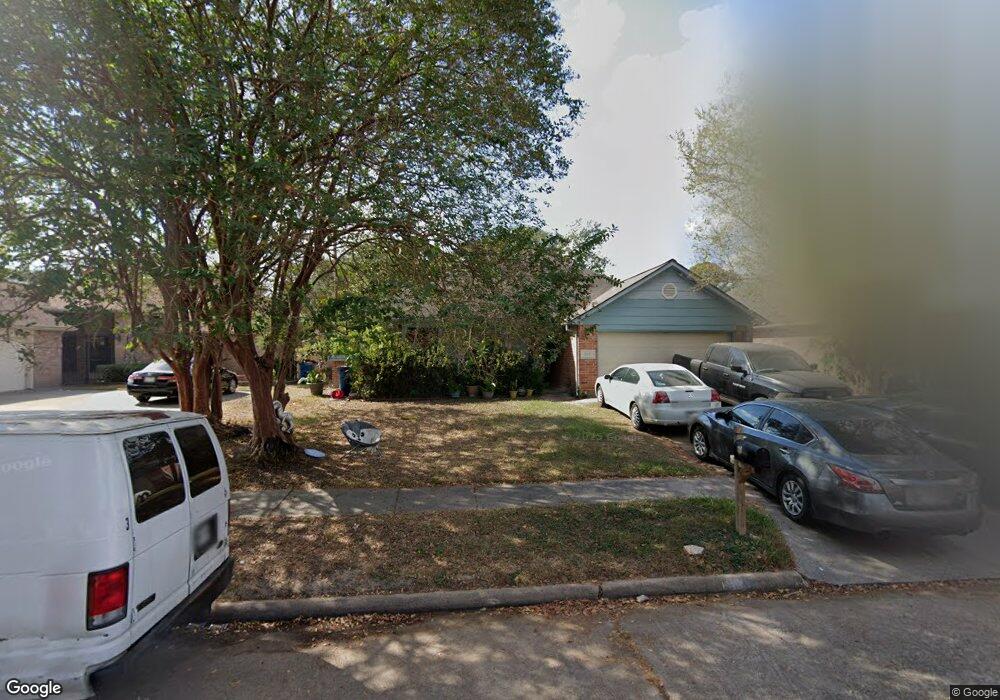
9007 Parkhill Forest Dr Houston, TX 77088
Inwood North NeighborhoodEstimated Value: $224,000 - $265,000
3
Beds
2
Baths
1,858
Sq Ft
$132/Sq Ft
Est. Value
About This Home
This home is located at 9007 Parkhill Forest Dr, Houston, TX 77088 and is currently estimated at $245,767, approximately $132 per square foot. 9007 Parkhill Forest Dr is a home located in Harris County with nearby schools including Nitsch Elementary School, Klein Intermediate School, and Klein Forest High School.
Ownership History
Date
Name
Owned For
Owner Type
Purchase Details
Closed on
May 17, 2023
Sold by
Garcia Dora Hilda
Bought by
Garcia Jose M
Current Estimated Value
Purchase Details
Closed on
Dec 28, 2011
Sold by
Wells Fargo Bank National Association
Bought by
Garcia Jose M and Garcia Dora H
Purchase Details
Closed on
Oct 22, 2010
Sold by
Feggett Susan and Willoughby Henry J
Bought by
Wells Fargo Bank National Association
Purchase Details
Closed on
Jul 30, 2004
Sold by
Sands Alice Irene Grubb and Sands Burley Lynn
Bought by
Willoughby Henry J and Feggett Susan
Home Financials for this Owner
Home Financials are based on the most recent Mortgage that was taken out on this home.
Original Mortgage
$92,000
Interest Rate
6.62%
Mortgage Type
Stand Alone First
Purchase Details
Closed on
Oct 30, 1995
Sold by
Sands Alice Irene Grubb
Bought by
Sands Burley Lynn
Create a Home Valuation Report for This Property
The Home Valuation Report is an in-depth analysis detailing your home's value as well as a comparison with similar homes in the area
Home Values in the Area
Average Home Value in this Area
Purchase History
| Date | Buyer | Sale Price | Title Company |
|---|---|---|---|
| Garcia Jose M | -- | None Listed On Document | |
| Garcia Jose M | -- | Lsi Title Agency Inc | |
| Wells Fargo Bank National Association | $74,205 | None Available | |
| Willoughby Henry J | -- | Fidelity National Title | |
| Sands Burley Lynn | -- | -- |
Source: Public Records
Mortgage History
| Date | Status | Borrower | Loan Amount |
|---|---|---|---|
| Previous Owner | Willoughby Henry J | $92,000 | |
| Closed | Willoughby Henry J | $23,000 |
Source: Public Records
Tax History Compared to Growth
Tax History
| Year | Tax Paid | Tax Assessment Tax Assessment Total Assessment is a certain percentage of the fair market value that is determined by local assessors to be the total taxable value of land and additions on the property. | Land | Improvement |
|---|---|---|---|---|
| 2025 | $4,901 | $202,522 | $56,700 | $145,822 |
| 2024 | $4,901 | $200,000 | $56,700 | $143,300 |
| 2023 | $4,901 | $245,152 | $56,700 | $188,452 |
| 2022 | $5,262 | $212,903 | $37,800 | $175,103 |
| 2021 | $4,210 | $161,575 | $23,625 | $137,950 |
| 2020 | $4,101 | $149,161 | $23,625 | $125,536 |
| 2019 | $2,833 | $100,000 | $20,790 | $79,210 |
| 2018 | $2,834 | $100,000 | $20,790 | $79,210 |
| 2017 | $2,834 | $100,000 | $20,790 | $79,210 |
| 2016 | $3,321 | $117,170 | $20,790 | $96,380 |
| 2015 | $3,157 | $98,000 | $20,790 | $77,210 |
| 2014 | $3,157 | $112,000 | $20,790 | $91,210 |
Source: Public Records
Map
Nearby Homes
- 8918 Bold Forest Dr
- 6222 Downwood Forest Dr
- 5831 Longforest Dr
- 5718 Longforest Dr
- 6006 Ogden Forest Dr
- 6111 Ogden Forest Dr
- 8810 Enchanted Forest Dr
- 5721 Breen Dr
- 5638 Fairview Forest Dr
- 6122 Gallant Forest Dr
- 6114 Elkwood Forest Dr
- 32 Regency Ln
- 6023 Elkwood Forest Dr
- 6713 Breen Dr
- 5942 Caruso Forest Dr
- 5935 Caruso Forest Dr
- 6011 Killough St
- 5523 Fair Forest Dr
- 5626 Spindle Dr
- 5930 Killough St
- 9011 Parkhill Forest Dr
- 9003 Parkhill Forest Dr
- 9006 Arlington Forest Dr
- 9002 Arlington Forest Dr
- 9010 Arlington Forest Dr
- 8915 Parkhill Forest Dr
- 9015 Parkhill Forest Dr
- 8934 Arlington Forest Dr
- 9014 Arlington Forest Dr
- 9006 Parkhill Forest Dr
- 9010 Parkhill Forest Dr
- 9002 Parkhill Forest Dr
- 8911 Parkhill Forest Dr
- 9014 Parkhill Forest Dr
- 8930 Arlington Forest Dr
- 8914 Parkhill Forest Dr
- 8907 Parkhill Forest Dr
- 8910 Parkhill Forest Dr
- 8926 Arlington Forest Dr
- 9007 Arlington Forest Dr