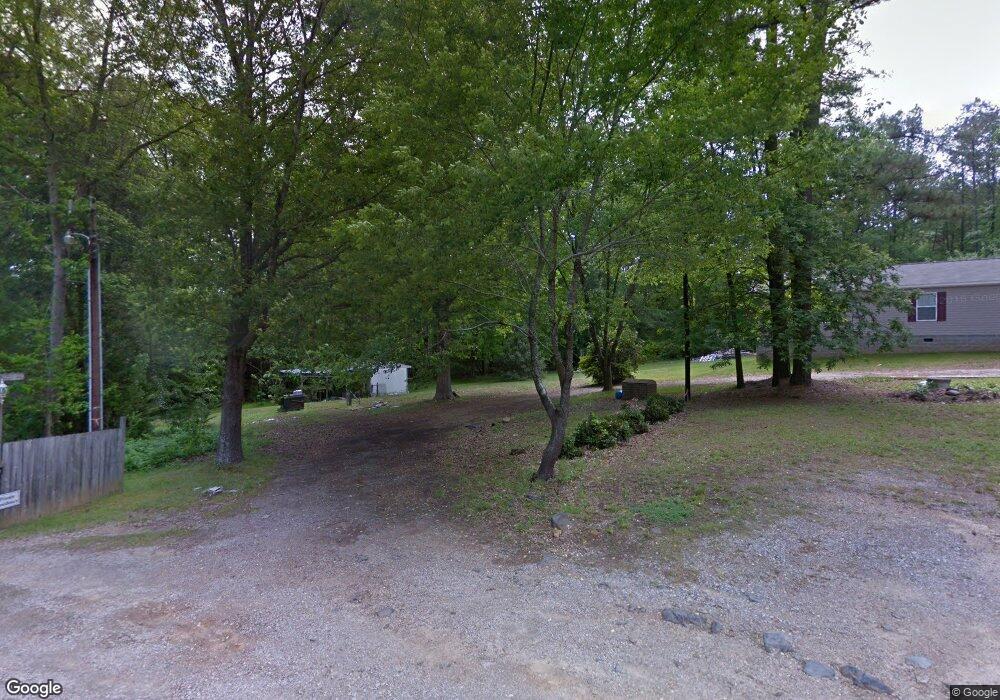
9008 April Cir Garner, NC 27529
Estimated Value: $179,000 - $395,000
2
Beds
2
Baths
798
Sq Ft
$360/Sq Ft
Est. Value
About This Home
This home is located at 9008 April Cir, Garner, NC 27529 and is currently estimated at $287,000, approximately $359 per square foot. 9008 April Cir is a home located in Wake County with nearby schools including Creech Road Elementary School, East Garner Middle School, and South Garner High.
Ownership History
Date
Name
Owned For
Owner Type
Purchase Details
Closed on
Nov 2, 2015
Sold by
Cmh Homes Inc
Bought by
Sanderford Tammy and Sanderford Richard Gilbert
Current Estimated Value
Home Financials for this Owner
Home Financials are based on the most recent Mortgage that was taken out on this home.
Original Mortgage
$168,905
Outstanding Balance
$131,472
Interest Rate
3.89%
Mortgage Type
FHA
Estimated Equity
$155,528
Purchase Details
Closed on
May 27, 2008
Sold by
Parker Larry L and Parker Frances W
Bought by
Sanderford Richard Gilbert
Home Financials for this Owner
Home Financials are based on the most recent Mortgage that was taken out on this home.
Original Mortgage
$49,000
Interest Rate
5.86%
Mortgage Type
Seller Take Back
Purchase Details
Closed on
Jul 11, 2005
Sold by
Rice Debra J
Bought by
Ford Roger M and Stephens Kenneth D
Create a Home Valuation Report for This Property
The Home Valuation Report is an in-depth analysis detailing your home's value as well as a comparison with similar homes in the area
Home Values in the Area
Average Home Value in this Area
Purchase History
| Date | Buyer | Sale Price | Title Company |
|---|---|---|---|
| Sanderford Tammy | $172,500 | Attorney | |
| Sanderford Richard Gilbert | $55,000 | None Available | |
| Ford Roger M | $35,000 | -- |
Source: Public Records
Mortgage History
| Date | Status | Borrower | Loan Amount |
|---|---|---|---|
| Open | Sanderford Tammy | $168,905 | |
| Previous Owner | Sanderford Richard Gilbert | $49,000 |
Source: Public Records
Tax History
| Year | Tax Paid | Tax Assessment Tax Assessment Total Assessment is a certain percentage of the fair market value that is determined by local assessors to be the total taxable value of land and additions on the property. | Land | Improvement |
|---|---|---|---|---|
| 2025 | $2,307 | $357,537 | $112,500 | $245,037 |
| 2024 | $2,240 | $357,537 | $112,500 | $245,037 |
| 2023 | $1,904 | $241,610 | $54,000 | $187,610 |
| 2022 | $1,765 | $241,610 | $54,000 | $187,610 |
| 2021 | $1,718 | $241,610 | $54,000 | $187,610 |
| 2020 | $1,690 | $241,610 | $54,000 | $187,610 |
| 2019 | $1,368 | $165,047 | $39,000 | $126,047 |
| 2018 | $1,259 | $165,047 | $39,000 | $126,047 |
| 2017 | $1,193 | $165,047 | $39,000 | $126,047 |
| 2016 | $1,172 | $165,447 | $39,000 | $126,447 |
Source: Public Records
Map
Nearby Homes
- 131 White Oak Garden Way
- 264 Meadowbark Bend Unit 43
- 288 Meadowbark Bend Unit 37
- 292 Meadowbark Bend Unit 36
- 104 Chesapeake Commons St Unit 62
- 103 Frosted Iris Ln Unit 192
- 123 Frosted Iris Ln Unit 187
- 115 Frosted Iris Ln Unit 189
- 127 Frosted Iris Ln Unit 186
- 131 Frosted Iris Ln Unit 185
- 111 Frosted Iris Ln Unit 190
- 204 White Oak Garden Way Unit 193
- 303 Chesapeake Commons St Unit 99
- 395 Chesapeake Commons St Unit 122
- 363 Chesapeake Commons St Unit 114
- 383 Chesapeake Commons St Unit 119
- 367 Chesapeake Commons St Unit 115
- 331 Chesapeake Commons St Unit 106
- 116 Silver Fir Ln Unit 240
- 104 Silver Fir Ln Unit 237
- 9004 April Cir
- 0 April Cir Unit 1965123
- 0 April Cir Unit 6 TR1965123
- 9009 April Cir
- 5601 Raynor Rd
- 5609 Raynor Rd
- 209 Meadowbark Bend
- 209 Meadowbark Bend
- 9005 April Cir
- 5613 Raynor Rd
- 104 White Oak Garden Way Unit 18
- 108 White Oak Garden Way Unit 17
- 5617 Raynor Rd
- 103 White Oak Garden Way Unit 48
- 115 White Oak Garden Way Unit 51
- 5621 Raynor Rd
- 5612 Raynor Rd
- 5616 Raynor Rd
- 123 White Oak Garden Way Unit 53
- 127 White Oak Garden Way Unit 54
Your Personal Tour Guide
Ask me questions while you tour the home.