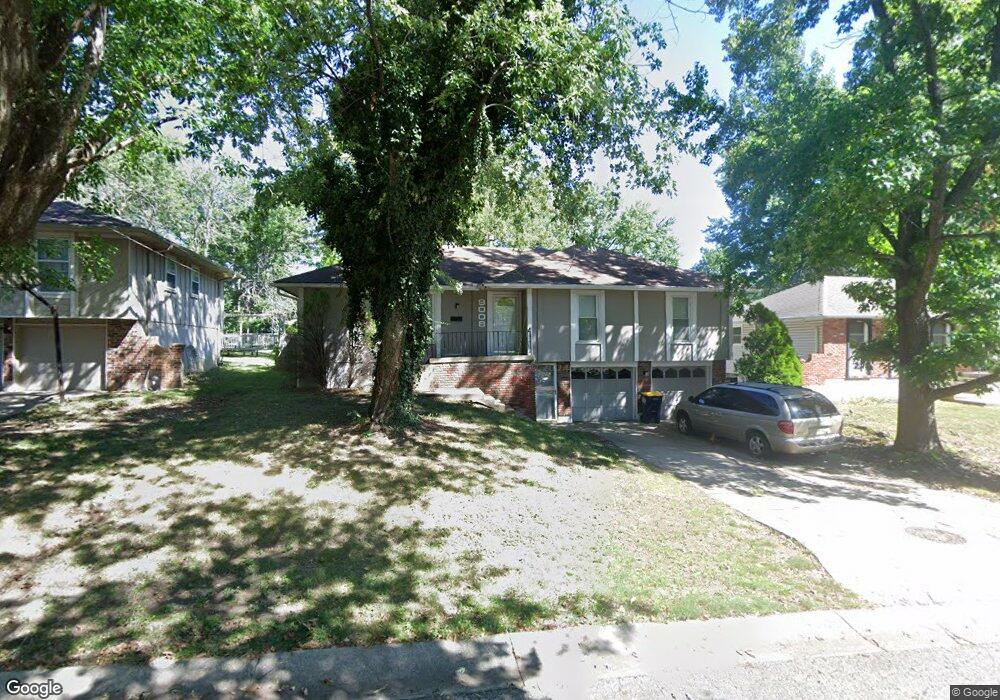
9008 E 90th Terrace Kansas City, MO 64138
White Oak NeighborhoodEstimated Value: $209,251 - $227,000
3
Beds
2
Baths
1,381
Sq Ft
$158/Sq Ft
Est. Value
About This Home
This home is located at 9008 E 90th Terrace, Kansas City, MO 64138 and is currently estimated at $217,563, approximately $157 per square foot. 9008 E 90th Terrace is a home located in Jackson County with nearby schools including Dobbs Elementary School, St Regis School, and Carver Christian Academy.
Ownership History
Date
Name
Owned For
Owner Type
Purchase Details
Closed on
Aug 31, 2015
Sold by
Bltrejv3 Kansas City Llc
Bought by
Csma Blt Llc
Current Estimated Value
Purchase Details
Closed on
Nov 21, 2013
Sold by
Traylor Damian and Traylor Damiam
Bought by
Blterjv3 Kansas City Llc
Purchase Details
Closed on
Dec 29, 2003
Sold by
Sackett Bradley and Sackett Melissa Mai
Bought by
Traylor Damian L
Home Financials for this Owner
Home Financials are based on the most recent Mortgage that was taken out on this home.
Original Mortgage
$115,090
Interest Rate
5.84%
Mortgage Type
FHA
Purchase Details
Closed on
Jan 13, 2003
Sold by
Sackett Bradley J
Bought by
Hua Melissa Mai T
Home Financials for this Owner
Home Financials are based on the most recent Mortgage that was taken out on this home.
Original Mortgage
$87,000
Interest Rate
6.16%
Mortgage Type
Purchase Money Mortgage
Create a Home Valuation Report for This Property
The Home Valuation Report is an in-depth analysis detailing your home's value as well as a comparison with similar homes in the area
Home Values in the Area
Average Home Value in this Area
Purchase History
| Date | Buyer | Sale Price | Title Company |
|---|---|---|---|
| Csma Blt Llc | -- | None Available | |
| Blterjv3 Kansas City Llc | $39,000 | None Available | |
| Bltrejv3 Kansas City Llc | $39,000 | None Available | |
| Traylor Damian L | -- | Kansas City Title | |
| Hua Melissa Mai T | -- | Ati Title Company | |
| Hua Melissa Mai T | -- | Ati Title Company |
Source: Public Records
Mortgage History
| Date | Status | Borrower | Loan Amount |
|---|---|---|---|
| Previous Owner | Traylor Damian L | $115,090 | |
| Previous Owner | Hua Melissa Mai T | $87,000 |
Source: Public Records
Tax History Compared to Growth
Tax History
| Year | Tax Paid | Tax Assessment Tax Assessment Total Assessment is a certain percentage of the fair market value that is determined by local assessors to be the total taxable value of land and additions on the property. | Land | Improvement |
|---|---|---|---|---|
| 2025 | $1,939 | $25,379 | $4,720 | $20,659 |
| 2024 | $1,904 | $22,401 | $3,127 | $19,274 |
| 2023 | $1,904 | $22,402 | $3,867 | $18,535 |
| 2022 | $1,900 | $19,190 | $2,869 | $16,321 |
| 2021 | $1,639 | $19,190 | $2,869 | $16,321 |
| 2020 | $1,731 | $19,162 | $2,869 | $16,293 |
| 2019 | $1,638 | $19,162 | $2,869 | $16,293 |
| 2018 | $989 | $10,809 | $1,974 | $8,835 |
| 2017 | $886 | $10,809 | $1,974 | $8,835 |
| 2016 | $886 | $9,399 | $3,214 | $6,185 |
| 2014 | $859 | $16,473 | $3,151 | $13,322 |
Source: Public Records
Map
Nearby Homes
- 9006 Tennessee Ave
- 9033 E 90th Terrace
- 8916 E 89th Terrace
- 8925 E 89th St
- 9109 E 89th St
- 9425 E 90th Terrace
- 8706 Kentucky Ave
- 8602 E 91st Terrace
- 9201 E 87th St
- 9218 Mckinley St
- 8617 Lane Ave
- 9414 Lewis Ave
- 9525 Manning Ave
- 8416 E 92nd Place
- 8618 Arlington Ave
- 9012 E 85th Terrace
- 8700 E Bannister Terrace
- 8525 Maple Ave
- 9203 Marsh Ave
- 8529 Crescent Ave
- 9012 E 90th Terrace
- 9004 E 90th Terrace
- 9009 E 90th Terrace
- 9016 E 90th Terrace
- 9005 E 90th Terrace
- 9013 E 90th Terrace
- 9017 E 90th Terrace
- 9009 Tennessee Ave
- 9001 E 90th Terrace
- 9024 E 90th Terrace
- 9021 E 90th Terrace
- 9007 Tennessee Ave
- 9010 Hunter St
- 9004 Hunter St
- 9000 Hunter St
- 8928 E 90 Terrace
- 9025 E 90th Terrace
- 8932 Hunter St
- 8928 E 90th Terrace
- 9103 Tennessee Ave