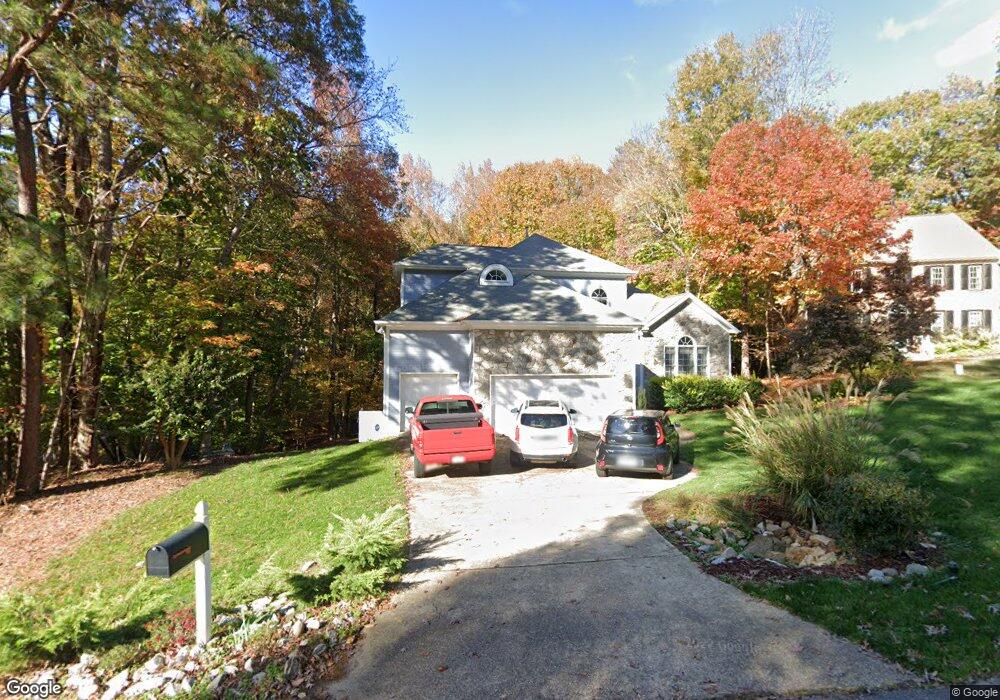
9008 Enfield Ct Raleigh, NC 27615
Woods of Tiffany NeighborhoodEstimated Value: $655,976 - $706,000
4
Beds
4
Baths
2,764
Sq Ft
$247/Sq Ft
Est. Value
About This Home
This home is located at 9008 Enfield Ct, Raleigh, NC 27615 and is currently estimated at $682,244, approximately $246 per square foot. 9008 Enfield Ct is a home located in Wake County with nearby schools including Baileywick Road Elementary School, West Millbrook Middle School, and Millbrook High School.
Ownership History
Date
Name
Owned For
Owner Type
Purchase Details
Closed on
Aug 31, 2017
Sold by
Comer Pamela R
Bought by
Tankersley Lawrence J and Tankersley Kathy A
Current Estimated Value
Home Financials for this Owner
Home Financials are based on the most recent Mortgage that was taken out on this home.
Original Mortgage
$250,000
Outstanding Balance
$209,103
Interest Rate
3.96%
Mortgage Type
New Conventional
Estimated Equity
$473,141
Purchase Details
Closed on
Jul 15, 2011
Sold by
Keyes Pamela C and Comer Pamela R
Bought by
Comer Pamela R
Home Financials for this Owner
Home Financials are based on the most recent Mortgage that was taken out on this home.
Original Mortgage
$205,300
Interest Rate
4.53%
Mortgage Type
New Conventional
Purchase Details
Closed on
Sep 11, 2003
Sold by
Keyes Kirk E
Bought by
Keyes Pamela C
Purchase Details
Closed on
Aug 27, 1998
Sold by
Chadwick John D
Bought by
Keyes Kirk E and Keyes Pamela C
Create a Home Valuation Report for This Property
The Home Valuation Report is an in-depth analysis detailing your home's value as well as a comparison with similar homes in the area
Home Values in the Area
Average Home Value in this Area
Purchase History
| Date | Buyer | Sale Price | Title Company |
|---|---|---|---|
| Tankersley Lawrence J | $360,000 | Investors Title Insurance Co | |
| Comer Pamela R | -- | Lsi | |
| Keyes Pamela C | -- | -- | |
| Keyes Kirk E | $245,500 | -- |
Source: Public Records
Mortgage History
| Date | Status | Borrower | Loan Amount |
|---|---|---|---|
| Open | Tankersley Lawrence J | $250,000 | |
| Previous Owner | Comer Pamela R | $205,300 |
Source: Public Records
Tax History Compared to Growth
Tax History
| Year | Tax Paid | Tax Assessment Tax Assessment Total Assessment is a certain percentage of the fair market value that is determined by local assessors to be the total taxable value of land and additions on the property. | Land | Improvement |
|---|---|---|---|---|
| 2025 | $3,331 | $517,733 | $125,000 | $392,733 |
| 2024 | $3,311 | $529,879 | $125,000 | $404,879 |
| 2023 | $3,034 | $386,530 | $90,000 | $296,530 |
| 2022 | $2,812 | $386,530 | $90,000 | $296,530 |
| 2021 | $2,736 | $386,530 | $90,000 | $296,530 |
| 2020 | $2,691 | $386,530 | $90,000 | $296,530 |
| 2019 | $2,989 | $363,533 | $120,000 | $243,533 |
| 2018 | $2,748 | $363,533 | $120,000 | $243,533 |
| 2017 | $2,605 | $363,533 | $120,000 | $243,533 |
| 2016 | $2,552 | $363,533 | $120,000 | $243,533 |
| 2015 | $2,225 | $317,437 | $73,800 | $243,637 |
| 2014 | $2,109 | $317,437 | $73,800 | $243,637 |
Source: Public Records
Map
Nearby Homes
- 1005 Berwyn Way
- 2408 Windsor Trail
- 717 Misty Isle Place
- 9709 Baileywick Rd
- 428 Kaywoody Ct
- 5204 Barton View Ct
- 2300 Valley Forge Dr
- 5428 Winding View Ln
- 8713 Gleneagles Dr
- 9021 Armitage Ct
- 9005 Pleasant Meadow Dr
- 600 Hawick Rd
- 14236 Wyndfield Cir
- 8904 Mildenhall Ct
- 8700 Aldersgate Way
- 10101 Daviton Ct
- 8825 Leeshire Ln
- 10109 Goodview Ct
- 1432 Quarter Point
- 2972 Tillinghast Trail
- 9004 Enfield Ct
- 9000 Enfield Ct
- 817 Berwyn Way
- 816 Berwyn Way
- 9005 Enfield Ct
- 9001 Enfield Ct
- 813 Berwyn Way
- 812 Berwyn Way
- 732 Lanham Place
- 917 Berwyn Way
- 808 Berwyn Way
- 809 Berwyn Way
- 9012 Morden Ct
- 921 Berwyn Way
- 9008 Morden Ct
- 9000 Morden Ct
- 9004 Morden Ct
- 9016 Morden Ct
- 804 Berwyn Way
- 726 Lanham Place