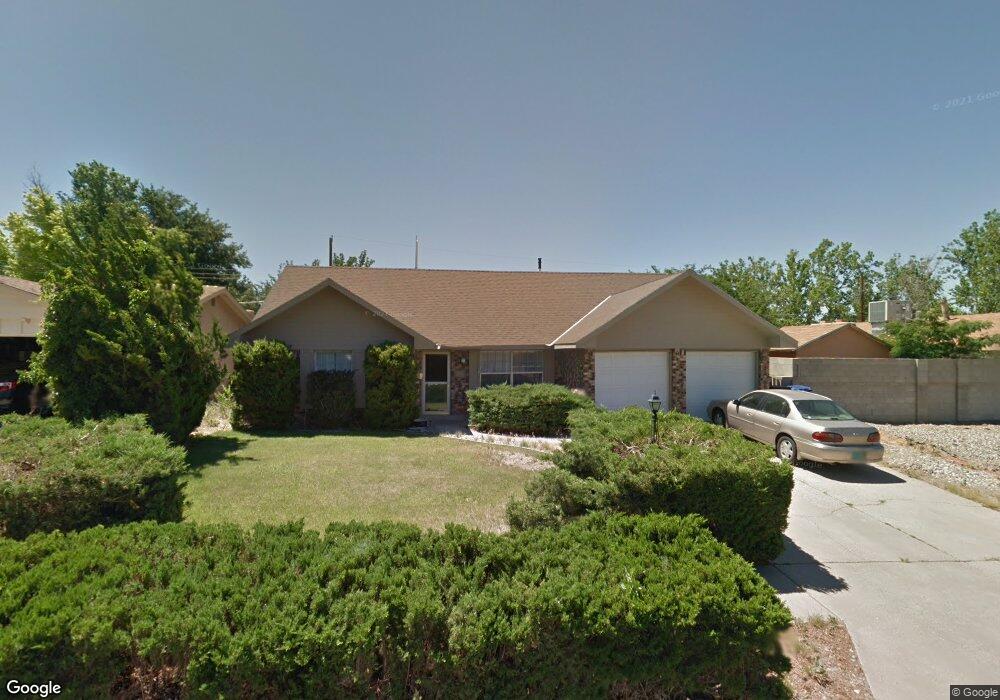
9008 Haines Ave NE Albuquerque, NM 87112
Bellehaven NeighborhoodEstimated Value: $303,000 - $323,000
3
Beds
2
Baths
1,556
Sq Ft
$202/Sq Ft
Est. Value
About This Home
This home is located at 9008 Haines Ave NE, Albuquerque, NM 87112 and is currently estimated at $314,597, approximately $202 per square foot. 9008 Haines Ave NE is a home located in Bernalillo County with nearby schools including Bellehaven Elementary School, Grant Middle School, and Sandia High School.
Ownership History
Date
Name
Owned For
Owner Type
Purchase Details
Closed on
Sep 16, 2016
Sold by
Buckley Cecilia Anne and Bowers Cecilia A
Bought by
Bowers David H
Current Estimated Value
Home Financials for this Owner
Home Financials are based on the most recent Mortgage that was taken out on this home.
Original Mortgage
$154,000
Outstanding Balance
$122,675
Interest Rate
3.43%
Mortgage Type
New Conventional
Estimated Equity
$191,922
Purchase Details
Closed on
Jan 21, 2009
Sold by
Bowers David H
Bought by
Bowers David H and Bowers Cecilia A
Home Financials for this Owner
Home Financials are based on the most recent Mortgage that was taken out on this home.
Original Mortgage
$168,800
Interest Rate
5.42%
Mortgage Type
New Conventional
Purchase Details
Closed on
Nov 20, 2002
Sold by
Martinez Susan G and Torres Mark
Bought by
Bowers David H
Home Financials for this Owner
Home Financials are based on the most recent Mortgage that was taken out on this home.
Original Mortgage
$108,000
Interest Rate
5.89%
Create a Home Valuation Report for This Property
The Home Valuation Report is an in-depth analysis detailing your home's value as well as a comparison with similar homes in the area
Home Values in the Area
Average Home Value in this Area
Purchase History
| Date | Buyer | Sale Price | Title Company |
|---|---|---|---|
| Bowers David H | -- | Fidelity National Title Of N | |
| Bowers David H | -- | U S Title | |
| Bowers David H | -- | Fidelity National Title Ins |
Source: Public Records
Mortgage History
| Date | Status | Borrower | Loan Amount |
|---|---|---|---|
| Open | Bowers David H | $154,000 | |
| Previous Owner | Bowers David H | $168,800 | |
| Previous Owner | Bowers David H | $108,000 | |
| Closed | Bowers David H | $27,000 |
Source: Public Records
Tax History Compared to Growth
Tax History
| Year | Tax Paid | Tax Assessment Tax Assessment Total Assessment is a certain percentage of the fair market value that is determined by local assessors to be the total taxable value of land and additions on the property. | Land | Improvement |
|---|---|---|---|---|
| 2025 | $2,492 | $62,909 | $12,979 | $49,930 |
| 2024 | $2,492 | $61,076 | $12,601 | $48,475 |
| 2023 | $2,449 | $59,298 | $12,234 | $47,064 |
| 2022 | $2,364 | $57,571 | $11,878 | $45,693 |
| 2021 | $2,282 | $55,894 | $11,532 | $44,362 |
| 2020 | $2,355 | $56,914 | $13,369 | $43,545 |
| 2019 | $2,284 | $55,256 | $12,979 | $42,277 |
| 2018 | $2,200 | $55,256 | $12,979 | $42,277 |
| 2017 | $2,130 | $53,647 | $12,601 | $41,046 |
| 2016 | $2,066 | $50,568 | $11,878 | $38,690 |
| 2015 | $49,095 | $49,095 | $11,532 | $37,563 |
| 2014 | $1,947 | $47,844 | $10,546 | $37,298 |
| 2013 | -- | $46,451 | $10,239 | $36,212 |
Source: Public Records
Map
Nearby Homes
- 9405 Cyndi Ct
- 1800 Field Dr NE
- 1820 Lester Dr NE
- 1313 Lester Dr NE
- 8501 Bellehaven Place NE
- 2014 Somervell St NE
- 8133 Princess Jeanne Ave NE
- 1345 Marron Cir NE
- 9716 Indian School Rd NE
- 9616 Morrow Ave NE
- 1613 Glorieta St NE
- 9521 Snow Heights Blvd NE
- 1109 Garcia St NE
- 1724 Glorieta St NE
- 8605 Mountain Rd NE
- 1021 Luthy Cir NE
- 2057 Virginia St NE
- 2026 Vermont St NE
- 1902 Inez Dr NE
- 1812 Mary Ellen St NE
- 9012 Haines Ave NE
- 8903 Hannett Ave NE
- 3301 Monroe E58 St NE
- 9100 Haines Ave NE
- 9001 Hannett Ave NE
- 9009 Haines Ave NE
- 9013 Haines Ave NE
- 9005 Hannett Ave NE
- 9013 Hannett Ave NE
- 9005 Haines Ave NE
- 9101 Haines Ave NE
- 8913 Robin Ave NE
- 9000 Haines Ave NE
- 9009 Hannett Ave NE
- 9105 Haines Ave NE
- 9001 Haines Ave NE
- 9017 Hannett Ave NE
- 9108 Haines Ave NE
- 8912 Haines Ave NE
- 9000 Hannett Ave NE