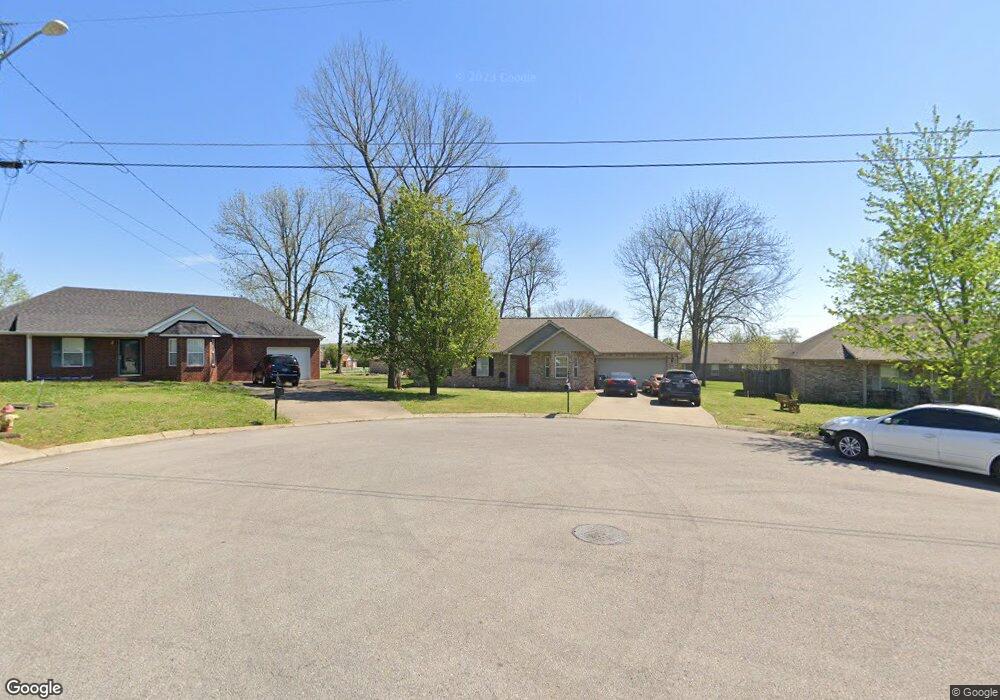
9008 Seton Ct Smyrna, TN 37167
Estimated Value: $314,786 - $350,000
--
Bed
2
Baths
1,174
Sq Ft
$290/Sq Ft
Est. Value
About This Home
This home is located at 9008 Seton Ct, Smyrna, TN 37167 and is currently estimated at $340,447, approximately $289 per square foot. 9008 Seton Ct is a home located in Rutherford County with nearby schools including Smyrna Primary School, Smyrna Middle School, and Smyrna High School.
Ownership History
Date
Name
Owned For
Owner Type
Purchase Details
Closed on
Nov 2, 2015
Sold by
Baeza Lisa Y
Bought by
Baeza Michael
Current Estimated Value
Home Financials for this Owner
Home Financials are based on the most recent Mortgage that was taken out on this home.
Original Mortgage
$120,000
Outstanding Balance
$94,705
Interest Rate
3.89%
Mortgage Type
New Conventional
Estimated Equity
$245,742
Purchase Details
Closed on
Dec 3, 2009
Sold by
Baeza Jose
Bought by
Baeza Lisa Y
Home Financials for this Owner
Home Financials are based on the most recent Mortgage that was taken out on this home.
Original Mortgage
$127,645
Interest Rate
5.01%
Purchase Details
Closed on
Nov 1, 2002
Sold by
J & K Builders
Bought by
Baeza Jose D and Baeza Angela M
Home Financials for this Owner
Home Financials are based on the most recent Mortgage that was taken out on this home.
Original Mortgage
$108,065
Interest Rate
5.98%
Create a Home Valuation Report for This Property
The Home Valuation Report is an in-depth analysis detailing your home's value as well as a comparison with similar homes in the area
Home Values in the Area
Average Home Value in this Area
Purchase History
| Date | Buyer | Sale Price | Title Company |
|---|---|---|---|
| Baeza Michael | $150,000 | -- | |
| Baeza Lisa Y | $130,000 | -- | |
| Baeza Jose D | $109,700 | -- |
Source: Public Records
Mortgage History
| Date | Status | Borrower | Loan Amount |
|---|---|---|---|
| Open | Baeza Michael | $120,000 | |
| Previous Owner | Baeza Jose D | $127,645 | |
| Previous Owner | Baeza Jose D | $108,065 |
Source: Public Records
Tax History Compared to Growth
Tax History
| Year | Tax Paid | Tax Assessment Tax Assessment Total Assessment is a certain percentage of the fair market value that is determined by local assessors to be the total taxable value of land and additions on the property. | Land | Improvement |
|---|---|---|---|---|
| 2025 | $1,589 | $66,150 | $13,750 | $52,400 |
| 2024 | $1,589 | $66,150 | $13,750 | $52,400 |
| 2023 | $1,589 | $66,150 | $13,750 | $52,400 |
| 2022 | $1,417 | $66,150 | $13,750 | $52,400 |
| 2021 | $1,306 | $44,725 | $8,750 | $35,975 |
| 2020 | $1,306 | $44,725 | $8,750 | $35,975 |
| 2019 | $1,306 | $44,725 | $8,750 | $35,975 |
| 2018 | $1,252 | $44,725 | $0 | $0 |
| 2017 | $1,072 | $30,075 | $0 | $0 |
| 2016 | $1,072 | $30,075 | $0 | $0 |
| 2015 | $1,072 | $30,075 | $0 | $0 |
| 2014 | $748 | $30,075 | $0 | $0 |
| 2013 | -- | $30,125 | $0 | $0 |
Source: Public Records
Map
Nearby Homes
- 10006 Nevada Ave
- 10000 Syracuse Dr
- 11004 Nevada Ave
- 4030 Snowbird Dr
- 6012 Westfork Dr
- 3082 Elevation GHI Plan at Rookers Bend
- 2282 Elevation GHI Plan at Rookers Bend
- 2618 Elevation GHI Plan at Rookers Bend
- 2309 Elevation GHI Plan at Rookers Bend
- 2581 Elevation GHI Plan at Rookers Bend
- 2540 Elevation GHI Plan at Rookers Bend
- 1989 Elevation GHI Plan at Rookers Bend
- 2151 Elevation GHI Plan at Rookers Bend
- 2700 Elevation GHI Plan at Rookers Bend
- 5620 Rooker Rd
- 5572 Rooker Rd
- 7649 Knobdate Rd
- 5496 Rooker Rd
- 5482 Rooker Rd
- 611 Cheyenne Ct
- 9010 Seton Ct
- 9006 Seton Ct
- 10009 Nevada Ave
- 10007 Nevada Ave
- 10011 Nevada Ave
- 9004 Seton Ct
- 9003 Lomond Dr
- 9011 Seton Ct
- 9005 Lomond Dr
- 10005 Nevada Ave
- 9009 Seton Ct
- 9007 Lomond Dr
- 9002 Seton Ct
- 9005 Seton Ct
- 10003 Nevada Ave
- 10008 Nevada Ave
- 9009 Lomond Dr
- 10010 Nevada Ave
- 9003 Seton Ct
- 10005 Syracuse Dr