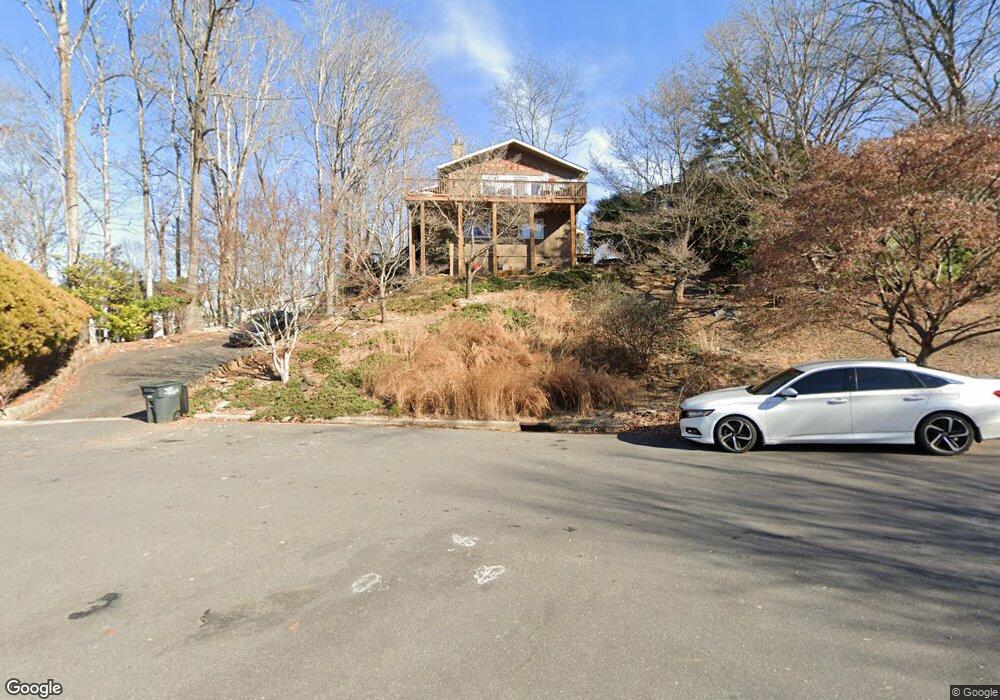
9009 Cebu Ct Unit 9 Fort Mill, SC 29708
Estimated Value: $418,000 - $480,000
--
Bed
3
Baths
1,456
Sq Ft
$304/Sq Ft
Est. Value
About This Home
This home is located at 9009 Cebu Ct Unit 9, Fort Mill, SC 29708 and is currently estimated at $442,904, approximately $304 per square foot. 9009 Cebu Ct Unit 9 is a home located in York County with nearby schools including Tega Cay Elementary School, Gold Hill Middle School, and Fort Mill High School.
Ownership History
Date
Name
Owned For
Owner Type
Purchase Details
Closed on
Jul 15, 2021
Sold by
Hubbell Martha A
Bought by
Gorodnia Daria and Rainu Tanveer Singh
Current Estimated Value
Home Financials for this Owner
Home Financials are based on the most recent Mortgage that was taken out on this home.
Original Mortgage
$370,500
Outstanding Balance
$336,171
Interest Rate
2.9%
Mortgage Type
New Conventional
Estimated Equity
$106,733
Purchase Details
Closed on
Jan 16, 2018
Sold by
Mashburn Bonnie L and Wilcox Bonnie L
Bought by
Hubbell Martha A
Home Financials for this Owner
Home Financials are based on the most recent Mortgage that was taken out on this home.
Original Mortgage
$224,852
Interest Rate
3.94%
Mortgage Type
FHA
Purchase Details
Closed on
Feb 1, 2017
Sold by
Williams Jeffrey M and Williams Laura
Bought by
Rosa Maria and Jaroma Theresa F Bayan
Create a Home Valuation Report for This Property
The Home Valuation Report is an in-depth analysis detailing your home's value as well as a comparison with similar homes in the area
Home Values in the Area
Average Home Value in this Area
Purchase History
| Date | Buyer | Sale Price | Title Company |
|---|---|---|---|
| Gorodnia Daria | $390,000 | Ntc | |
| Hubbell Martha A | $229,000 | None Available | |
| Rosa Maria | $22,500 | None Available |
Source: Public Records
Mortgage History
| Date | Status | Borrower | Loan Amount |
|---|---|---|---|
| Open | Gorodnia Daria | $370,500 | |
| Previous Owner | Hubbell Martha A | $224,852 |
Source: Public Records
Tax History Compared to Growth
Tax History
| Year | Tax Paid | Tax Assessment Tax Assessment Total Assessment is a certain percentage of the fair market value that is determined by local assessors to be the total taxable value of land and additions on the property. | Land | Improvement |
|---|---|---|---|---|
| 2024 | $3,353 | $12,963 | $1,800 | $11,163 |
| 2023 | $3,210 | $12,962 | $1,800 | $11,162 |
| 2022 | $3,180 | $12,962 | $1,800 | $11,162 |
| 2021 | -- | $8,644 | $1,800 | $6,844 |
| 2020 | $2,273 | $8,644 | $0 | $0 |
| 2019 | $2,489 | $8,580 | $0 | $0 |
| 2018 | $1,652 | $8,580 | $0 | $0 |
| 2017 | $1,591 | $5,320 | $0 | $0 |
| 2016 | $1,586 | $5,320 | $0 | $0 |
| 2014 | $1,374 | $5,320 | $1,800 | $3,520 |
| 2013 | $1,374 | $5,864 | $1,964 | $3,900 |
Source: Public Records
Map
Nearby Homes
- 9009 Cebu Ct
- 9001 Windjammer Dr
- 29010 Silver Fox Dr
- 9111 Windjammer Dr
- 2045 Driftwood Cir
- 10017 Bora Dr
- 25040 Timberlake Dr
- 27056 Catamaran Dr
- 25011 Club View Dr
- 10046 Tepa Place
- 10045 Tepa Place
- 6027 Windjammer Dr
- 10043 Tepa Place
- 24014 Tidal Way
- 2010 Bessbrook Rd
- 714 Deerbrook Ln
- 2065 Calloway Pines Dr
- 621 Pine Links Dr
- 546 Pine Links Dr
- 7042 Chelsea Day Ln
- 9010 Cebu Ct
- 9016 Palau Ct
- 9016 Palau Ct Unit 16
- 9011 Cebu Ct
- 9011 Cebu Ct Unit 11
- 9014 Palau Ct
- 9007 Cebu Ct
- 9007 Cebu Ct
- 9017 Palau Ct
- 9015 Palau Ct
- 9015 Palau Ct Unit 15
- 9017 Palau Ct Unit 17
- 9005 Cebu Ct
- 9018 Palau Ct
- 9013 Windjammer Dr
- 9003 Windjammer Dr
- 9003 Windjammer Dr Unit 2a
- 9002 Windjammer Dr
- 9032 Palau Ct Unit 32
- 9033 Palau Ct Unit 33