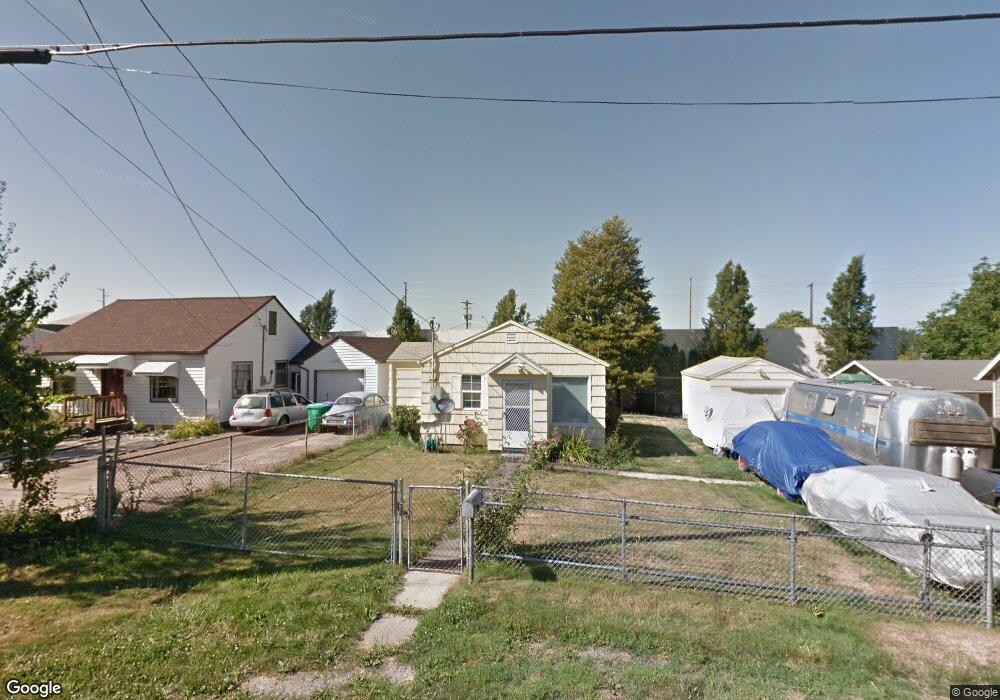
9009 NE Emerson St Portland, OR 97220
Sumner NeighborhoodEstimated Value: $256,000 - $298,816
1
Bed
1
Bath
540
Sq Ft
$523/Sq Ft
Est. Value
About This Home
This home is located at 9009 NE Emerson St, Portland, OR 97220 and is currently estimated at $282,204, approximately $522 per square foot. 9009 NE Emerson St is a home located in Multnomah County with nearby schools including Shaver Elementary School, Parkrose Middle School, and Parkrose High School.
Ownership History
Date
Name
Owned For
Owner Type
Purchase Details
Closed on
Jul 26, 2004
Sold by
Richards Sandra Katie
Bought by
Ganslein David H
Current Estimated Value
Home Financials for this Owner
Home Financials are based on the most recent Mortgage that was taken out on this home.
Original Mortgage
$40,500
Outstanding Balance
$20,469
Interest Rate
6.29%
Mortgage Type
Purchase Money Mortgage
Estimated Equity
$261,735
Purchase Details
Closed on
Sep 10, 2002
Sold by
Clark Gregory Hoyt
Bought by
Richards Sandra Katie
Home Financials for this Owner
Home Financials are based on the most recent Mortgage that was taken out on this home.
Original Mortgage
$78,000
Interest Rate
4.87%
Mortgage Type
Purchase Money Mortgage
Purchase Details
Closed on
Jan 20, 1995
Sold by
Hardin Michael A
Bought by
Clark Gregory Hoyt
Home Financials for this Owner
Home Financials are based on the most recent Mortgage that was taken out on this home.
Original Mortgage
$55,080
Interest Rate
9.28%
Mortgage Type
Assumption
Create a Home Valuation Report for This Property
The Home Valuation Report is an in-depth analysis detailing your home's value as well as a comparison with similar homes in the area
Home Values in the Area
Average Home Value in this Area
Purchase History
| Date | Buyer | Sale Price | Title Company |
|---|---|---|---|
| Ganslein David H | $86,750 | Fidelity Natl Title Co Of Or | |
| Richards Sandra Katie | $78,000 | Fidelity National Title Co | |
| Clark Gregory Hoyt | $54,000 | Chicago Title |
Source: Public Records
Mortgage History
| Date | Status | Borrower | Loan Amount |
|---|---|---|---|
| Open | Ganslein David H | $40,500 | |
| Previous Owner | Richards Sandra Katie | $78,000 | |
| Previous Owner | Clark Gregory Hoyt | $55,080 |
Source: Public Records
Tax History Compared to Growth
Tax History
| Year | Tax Paid | Tax Assessment Tax Assessment Total Assessment is a certain percentage of the fair market value that is determined by local assessors to be the total taxable value of land and additions on the property. | Land | Improvement |
|---|---|---|---|---|
| 2024 | $1,998 | $88,350 | -- | -- |
| 2023 | $1,998 | $85,780 | $0 | $0 |
| 2022 | $1,878 | $83,290 | $0 | $0 |
| 2021 | $1,847 | $80,870 | $0 | $0 |
| 2020 | $1,715 | $78,520 | $0 | $0 |
| 2019 | $1,673 | $76,240 | $0 | $0 |
| 2018 | $1,568 | $74,020 | $0 | $0 |
| 2017 | $1,511 | $71,870 | $0 | $0 |
| 2016 | $1,458 | $69,780 | $0 | $0 |
| 2015 | $1,430 | $67,750 | $0 | $0 |
| 2014 | $1,400 | $65,780 | $0 | $0 |
Source: Public Records
Map
Nearby Homes
- 0 NE 95th Ave
- 8335 NE Wygant St
- 4534 NE 95th Ave
- 4840 NE 99th Ave
- 4517 NE 85th Ave
- 8110 NE Wygant St
- 4435 NE 83rd Ave
- 4555 NE 81st Ave
- 4724 NE 101st Ave
- 4204 NE Maywood Place
- 9101 NE Cliff St
- 4312 NE 99th Ave
- 4214 NE 81st Ave
- 4304 NE 79th Ave
- 4731 NE 106th Ave
- 4523 NE 105th Ave
- 10121 NE Shaver St
- 8114 NE Failing St
- 4416 NE 75th Ave
- 8620 NE Beech St
- 8963 NE Emerson St
- 9021 NE Emerson St
- 9027 NE Emerson St
- 8951 NE Emerson St
- 9008 NE Emerson St
- 5375 NE 91st Ave
- 9024 NE Emerson St
- 8950 NE Emerson St
- 5235 NE 91st Ave
- 8900 NE Killingsworth St
- 9009 NE Sumner St
- 5240 NE 89th Ave
- 9015 NE Sumner St
- 8949 NE Sumner St
- 9023 NE Sumner St
- 5209 NE 91st Ave
- 8931 NE Sumner St
- 5244 NE 91st Ave
- 5216 NE 89th Ave
- 5230 NE 91st Ave