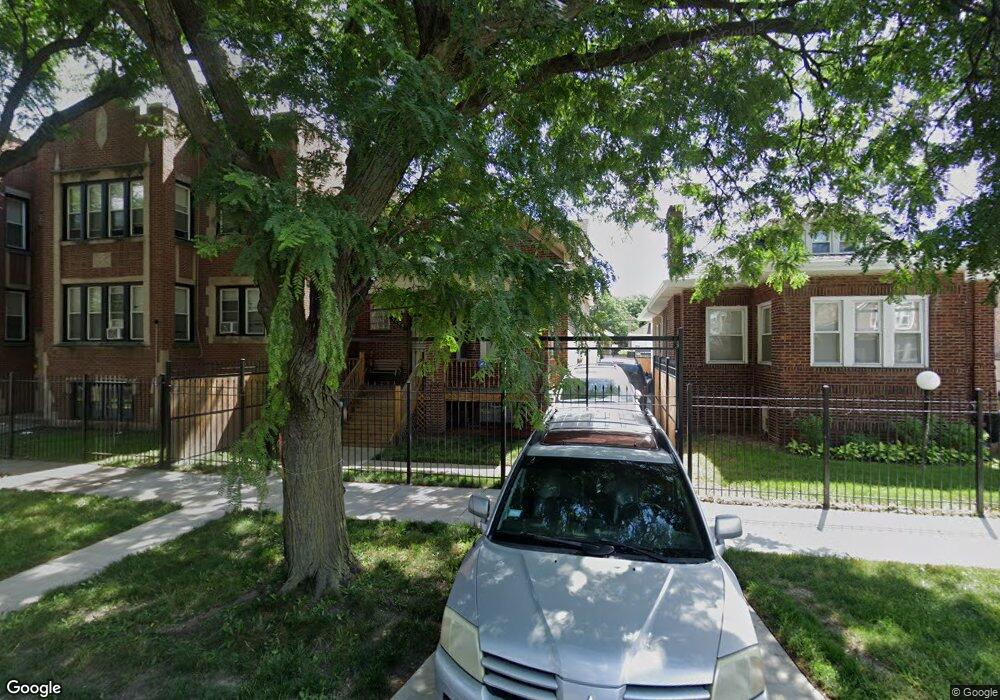
9009 S Loomis St Chicago, IL 60620
Brainerd NeighborhoodEstimated Value: $225,164 - $317,000
4
Beds
3
Baths
2,000
Sq Ft
$134/Sq Ft
Est. Value
About This Home
This home is located at 9009 S Loomis St, Chicago, IL 60620 and is currently estimated at $268,791, approximately $134 per square foot. 9009 S Loomis St is a home located in Cook County with nearby schools including Fort Dearborn Elementary School, Harlan Community Academy High School, and CICS - Longwood Campus.
Ownership History
Date
Name
Owned For
Owner Type
Purchase Details
Closed on
Oct 2, 2018
Sold by
Shaun Read & Nicholas L L C
Bought by
Jenkins Eddie L
Current Estimated Value
Home Financials for this Owner
Home Financials are based on the most recent Mortgage that was taken out on this home.
Original Mortgage
$176,739
Outstanding Balance
$156,867
Interest Rate
5.37%
Mortgage Type
FHA
Estimated Equity
$111,924
Purchase Details
Closed on
May 24, 2011
Sold by
Secretary Of Housing & Urban Development
Bought by
Shaun Read & Nicholas Llc
Purchase Details
Closed on
Aug 27, 2010
Sold by
Moore Ronald and Moore Linda
Bought by
Secretary Of Housing & Urban Development
Purchase Details
Closed on
Aug 4, 1995
Sold by
Walter Drunita and Steward Drunita
Bought by
Moore Ronald and Moore Linda
Home Financials for this Owner
Home Financials are based on the most recent Mortgage that was taken out on this home.
Original Mortgage
$60,123
Interest Rate
7.51%
Mortgage Type
FHA
Create a Home Valuation Report for This Property
The Home Valuation Report is an in-depth analysis detailing your home's value as well as a comparison with similar homes in the area
Home Values in the Area
Average Home Value in this Area
Purchase History
| Date | Buyer | Sale Price | Title Company |
|---|---|---|---|
| Jenkins Eddie L | $180,000 | First American Title | |
| Shaun Read & Nicholas Llc | -- | Stewart Title Company | |
| Secretary Of Housing & Urban Development | -- | None Available | |
| Moore Ronald | $60,000 | -- |
Source: Public Records
Mortgage History
| Date | Status | Borrower | Loan Amount |
|---|---|---|---|
| Open | Jenkins Eddie L | $176,739 | |
| Previous Owner | Moore Ronald | $60,123 |
Source: Public Records
Tax History Compared to Growth
Tax History
| Year | Tax Paid | Tax Assessment Tax Assessment Total Assessment is a certain percentage of the fair market value that is determined by local assessors to be the total taxable value of land and additions on the property. | Land | Improvement |
|---|---|---|---|---|
| 2024 | $2,538 | $12,000 | $3,919 | $8,081 |
| 2023 | $2,475 | $12,000 | $3,094 | $8,906 |
| 2022 | $2,475 | $12,000 | $3,094 | $8,906 |
| 2021 | $2,420 | $11,999 | $3,093 | $8,906 |
| 2020 | $3,254 | $14,570 | $3,093 | $11,477 |
| 2019 | $3,225 | $16,011 | $3,093 | $12,918 |
| 2018 | $3,171 | $16,011 | $3,093 | $12,918 |
| 2017 | $2,620 | $12,144 | $2,681 | $9,463 |
| 2016 | $2,438 | $12,144 | $2,681 | $9,463 |
| 2015 | $2,231 | $12,144 | $2,681 | $9,463 |
| 2014 | $1,991 | $10,706 | $2,475 | $8,231 |
| 2013 | $1,952 | $10,706 | $2,475 | $8,231 |
Source: Public Records
Map
Nearby Homes
- 9051 S Ada St
- 8914 S Throop St
- 9107 S Bishop St
- 8924 S Elizabeth St
- 9046 S Laflin St
- 8949 S Elizabeth St
- 9019 S Justine St
- 8848 S Bishop St
- 8827 S Loomis St
- 8822 S Ada St
- 8841 S Elizabeth St
- 9155 S Laflin St
- 9137 S Justine St
- 9101 S Racine Ave
- 8922 S May St
- 8817 S Elizabeth St
- 9222 S Ada St
- 9230 S Loomis St
- 8810 S Racine Ave
- 1114 W 90th St
- 9011 S Loomis St
- 9001 S Loomis St
- 9001 S Loomis St Unit G
- 1351 W 90th St Unit 12
- 9017 S Loomis St
- 9017 S Loomis St
- 9019 S Loomis St
- 9012 S Ada St
- 9008 S Ada St
- 9004 S Ada St
- 9000 S Ada St
- 9014 S Ada St
- 9023 S Loomis St Unit 1
- 9012 S Loomis St
- 9018 S Ada St
- 9008 S Loomis St
- 9027 S Loomis St Unit 1
- 9027 S Loomis St
- 9000 S Loomis St Unit 2
- 9000 S Loomis St