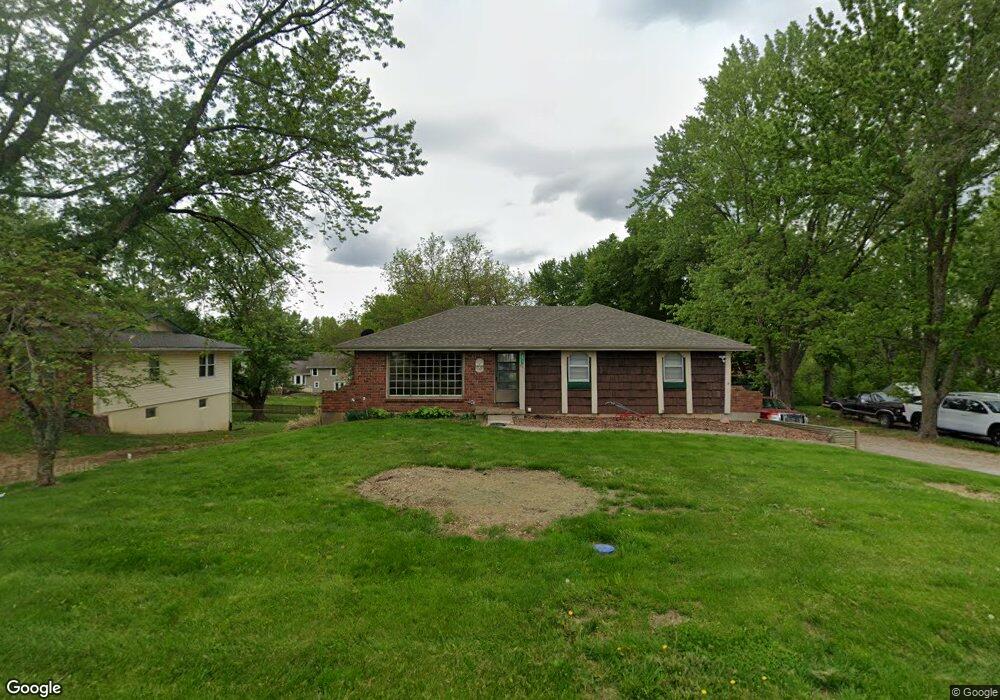
901 3rd St Camden Point, MO 64018
Estimated Value: $271,621 - $295,000
2
Beds
2
Baths
1,300
Sq Ft
$220/Sq Ft
Est. Value
About This Home
This home is located at 901 3rd St, Camden Point, MO 64018 and is currently estimated at $285,905, approximately $219 per square foot. 901 3rd St is a home located in Platte County with nearby schools including North Platte Elementary School, North Platte Intermediate School, and North Platte Junior High School.
Ownership History
Date
Name
Owned For
Owner Type
Purchase Details
Closed on
Jun 22, 2022
Sold by
Stalder and Daniel
Bought by
Hill Travis
Current Estimated Value
Home Financials for this Owner
Home Financials are based on the most recent Mortgage that was taken out on this home.
Original Mortgage
$190,000
Outstanding Balance
$180,576
Interest Rate
5.3%
Mortgage Type
New Conventional
Estimated Equity
$105,329
Purchase Details
Closed on
Dec 26, 2017
Sold by
Mclaughlin Jon
Bought by
Ball Sasha R
Home Financials for this Owner
Home Financials are based on the most recent Mortgage that was taken out on this home.
Original Mortgage
$137,464
Interest Rate
3.92%
Mortgage Type
FHA
Purchase Details
Closed on
Sep 12, 2017
Sold by
Sartorius Carl Robert
Bought by
Carl Robert Sartorius Jr Revocable Inter
Create a Home Valuation Report for This Property
The Home Valuation Report is an in-depth analysis detailing your home's value as well as a comparison with similar homes in the area
Home Values in the Area
Average Home Value in this Area
Purchase History
| Date | Buyer | Sale Price | Title Company |
|---|---|---|---|
| Hill Travis | -- | Kansas City Title | |
| Ball Sasha R | -- | Stewart Title Company | |
| Carl Robert Sartorius Jr Revocable Inter | -- | None Available |
Source: Public Records
Mortgage History
| Date | Status | Borrower | Loan Amount |
|---|---|---|---|
| Open | Hill Travis | $190,000 | |
| Previous Owner | Ball Sasha R | $137,464 |
Source: Public Records
Tax History Compared to Growth
Tax History
| Year | Tax Paid | Tax Assessment Tax Assessment Total Assessment is a certain percentage of the fair market value that is determined by local assessors to be the total taxable value of land and additions on the property. | Land | Improvement |
|---|---|---|---|---|
| 2025 | $2,249 | $29,994 | $4,006 | $25,988 |
| 2024 | $2,154 | $29,994 | $4,006 | $25,988 |
| 2023 | $2,154 | $29,994 | $4,006 | $25,988 |
| 2022 | $1,900 | $26,195 | $4,006 | $22,189 |
| 2021 | $1,906 | $26,195 | $4,006 | $22,189 |
| 2020 | $1,727 | $23,209 | $2,850 | $20,359 |
| 2019 | $1,727 | $23,209 | $2,850 | $20,359 |
| 2018 | $1,738 | $23,209 | $2,850 | $20,359 |
| 2017 | $1,737 | $23,209 | $2,850 | $20,359 |
| 2016 | $1,720 | $23,209 | $2,850 | $20,359 |
| 2015 | $1,720 | $23,209 | $2,850 | $20,359 |
| 2013 | $1,678 | $23,209 | $0 | $0 |
Source: Public Records
Map
Nearby Homes