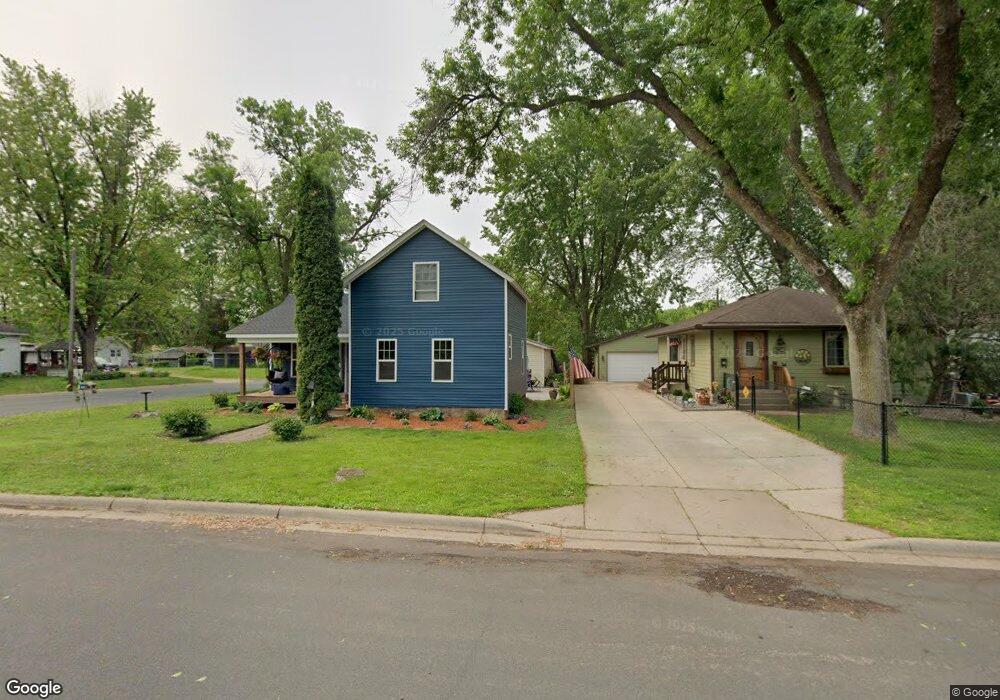
901 3rd St W Hastings, MN 55033
Hastings-Marshan Township NeighborhoodEstimated Value: $260,000 - $299,000
3
Beds
2
Baths
1,221
Sq Ft
$225/Sq Ft
Est. Value
About This Home
This home is located at 901 3rd St W, Hastings, MN 55033 and is currently estimated at $274,993, approximately $225 per square foot. 901 3rd St W is a home located in Dakota County with nearby schools including Hastings Middle School, Christa Mcauliffe Elementary School, and Hastings High School.
Ownership History
Date
Name
Owned For
Owner Type
Purchase Details
Closed on
Jun 7, 2016
Sold by
Briol Michelle M
Bought by
Allen Marcus P and Allen Dorthy E
Current Estimated Value
Home Financials for this Owner
Home Financials are based on the most recent Mortgage that was taken out on this home.
Original Mortgage
$154,156
Interest Rate
3.75%
Mortgage Type
FHA
Purchase Details
Closed on
Aug 14, 1998
Sold by
Casey Charles J and Casey Paula J
Bought by
Briol Michelle M
Create a Home Valuation Report for This Property
The Home Valuation Report is an in-depth analysis detailing your home's value as well as a comparison with similar homes in the area
Home Values in the Area
Average Home Value in this Area
Purchase History
| Date | Buyer | Sale Price | Title Company |
|---|---|---|---|
| Allen Marcus P | $157,000 | Dca Title | |
| Briol Michelle M | $68,500 | -- |
Source: Public Records
Mortgage History
| Date | Status | Borrower | Loan Amount |
|---|---|---|---|
| Previous Owner | Allen Marcus P | $154,156 |
Source: Public Records
Tax History Compared to Growth
Tax History
| Year | Tax Paid | Tax Assessment Tax Assessment Total Assessment is a certain percentage of the fair market value that is determined by local assessors to be the total taxable value of land and additions on the property. | Land | Improvement |
|---|---|---|---|---|
| 2024 | $2,598 | $241,100 | $56,700 | $184,400 |
| 2023 | $2,598 | $237,800 | $56,700 | $181,100 |
| 2022 | $2,174 | $218,800 | $56,600 | $162,200 |
| 2021 | $2,026 | $192,800 | $49,300 | $143,500 |
| 2020 | $2,176 | $180,400 | $46,900 | $133,500 |
| 2019 | $2,037 | $186,200 | $44,700 | $141,500 |
| 2018 | $1,824 | $168,400 | $42,500 | $125,900 |
| 2017 | $1,588 | $149,400 | $40,500 | $108,900 |
| 2016 | $2,004 | $133,600 | $37,900 | $95,700 |
| 2015 | $2,030 | $110,673 | $29,931 | $80,742 |
| 2014 | -- | $112,090 | $28,963 | $83,127 |
| 2013 | -- | $95,086 | $25,064 | $70,022 |
Source: Public Records
Map
Nearby Homes