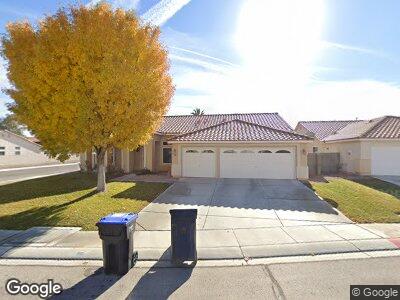
901 Bear Mountain Ave North Las Vegas, NV 89031
Craig Ranch NeighborhoodEstimated Value: $593,000 - $620,000
4
Beds
3
Baths
2,747
Sq Ft
$221/Sq Ft
Est. Value
About This Home
This home is located at 901 Bear Mountain Ave, North Las Vegas, NV 89031 and is currently estimated at $607,096, approximately $221 per square foot. 901 Bear Mountain Ave is a home located in Clark County with nearby schools including Lee Antonello Elementary School, Brian & Teri Cram Middle School, and Legacy High School.
Ownership History
Date
Name
Owned For
Owner Type
Purchase Details
Closed on
May 13, 2010
Sold by
Dynamic Asset Solutions Llc
Bought by
Barber James and Barber Rafaela
Current Estimated Value
Home Financials for this Owner
Home Financials are based on the most recent Mortgage that was taken out on this home.
Original Mortgage
$242,095
Interest Rate
5.03%
Mortgage Type
VA
Purchase Details
Closed on
Nov 18, 2009
Sold by
Duncan Jeremy L and Duncan Heidi
Bought by
Dynamic Asset Solutions Llc
Purchase Details
Closed on
Jan 22, 2002
Sold by
Pardee Construction Company Of Nevada
Bought by
Duncan Jeremy L and Duncan Heidi
Home Financials for this Owner
Home Financials are based on the most recent Mortgage that was taken out on this home.
Original Mortgage
$249,304
Interest Rate
7.13%
Create a Home Valuation Report for This Property
The Home Valuation Report is an in-depth analysis detailing your home's value as well as a comparison with similar homes in the area
Home Values in the Area
Average Home Value in this Area
Purchase History
| Date | Buyer | Sale Price | Title Company |
|---|---|---|---|
| Barber James | $237,000 | Fidelity National Title Las | |
| Dynamic Asset Solutions Llc | $151,600 | None Available | |
| Duncan Jeremy L | $220,728 | National Title Company |
Source: Public Records
Mortgage History
| Date | Status | Borrower | Loan Amount |
|---|---|---|---|
| Open | Barber James | $239,290 | |
| Closed | Barber James | $242,095 | |
| Previous Owner | Duncan Jeremy L | $454,206 | |
| Previous Owner | Duncan Jeremy | $52,391 | |
| Previous Owner | Duncan Jeremy L | $380,000 | |
| Previous Owner | Duncan Jeremy L | $232,000 | |
| Previous Owner | Duncan Jeremy L | $58,000 | |
| Previous Owner | Duncan Jeremy L | $249,304 |
Source: Public Records
Tax History Compared to Growth
Tax History
| Year | Tax Paid | Tax Assessment Tax Assessment Total Assessment is a certain percentage of the fair market value that is determined by local assessors to be the total taxable value of land and additions on the property. | Land | Improvement |
|---|---|---|---|---|
| 2025 | $4,114 | $176,626 | $43,050 | $133,576 |
| 2024 | $3,801 | $176,626 | $43,050 | $133,576 |
| 2023 | $3,801 | $166,142 | $40,600 | $125,542 |
| 2022 | $3,520 | $149,157 | $34,300 | $114,857 |
| 2021 | $3,259 | $141,373 | $32,200 | $109,173 |
| 2020 | $3,024 | $139,248 | $31,150 | $108,098 |
| 2019 | $2,834 | $133,857 | $27,650 | $106,207 |
| 2018 | $2,704 | $123,853 | $21,350 | $102,503 |
| 2017 | $3,822 | $113,929 | $19,250 | $94,679 |
| 2016 | $2,531 | $100,166 | $16,450 | $83,716 |
| 2015 | $2,526 | $79,129 | $12,250 | $66,879 |
| 2014 | $2,447 | $72,021 | $10,500 | $61,521 |
Source: Public Records
Map
Nearby Homes
- 813 Bluebird Hill Ave
- 619 Zalataia Way
- 1306 Big Tree Ave
- 6128 Casper Sands Ct
- 6525 Bismark Hills St
- 1003 Dover Glen Dr
- 6222 Eliza Ln
- 520 Blackbird Knoll Ct
- 6436 Point Break St
- 635 Dry Valley Ave
- 6119 Magic Mesa St
- 1004 Bluebird Ridge Ct
- 1413 Gentle Brook St
- 1112 Adobe Creek Ct
- 448 Bright Moon Ave
- 6649 Maple Mesa St
- 411 Hellebores Ave
- 1505 Barrington Oaks St
- 6715 Maple Mesa St
- 378 Hellebores Ave
- 901 Bear Mountain Ave
- 905 Bear Mountain Ave
- 817 Bear Mountain Ave
- 902 Choctaw Ave
- 906 Choctaw Ave
- 909 Bear Mountain Ave
- 6324 Little Mountain St
- 910 Choctaw Ave
- 818 Choctaw Ave
- 813 Bear Mountain Ave
- 902 Bear Mountain Ave
- 913 Bear Mountain Ave
- 820 Bear Mountain Ave
- 6328 Little Mountain St
- 914 Choctaw Ave
- 814 Choctaw Ave
- 816 Bear Mountain Ave
- 6325 Bunch Grass Ct
- 809 Bear Mountain Ave
- 905 Choctaw Ave