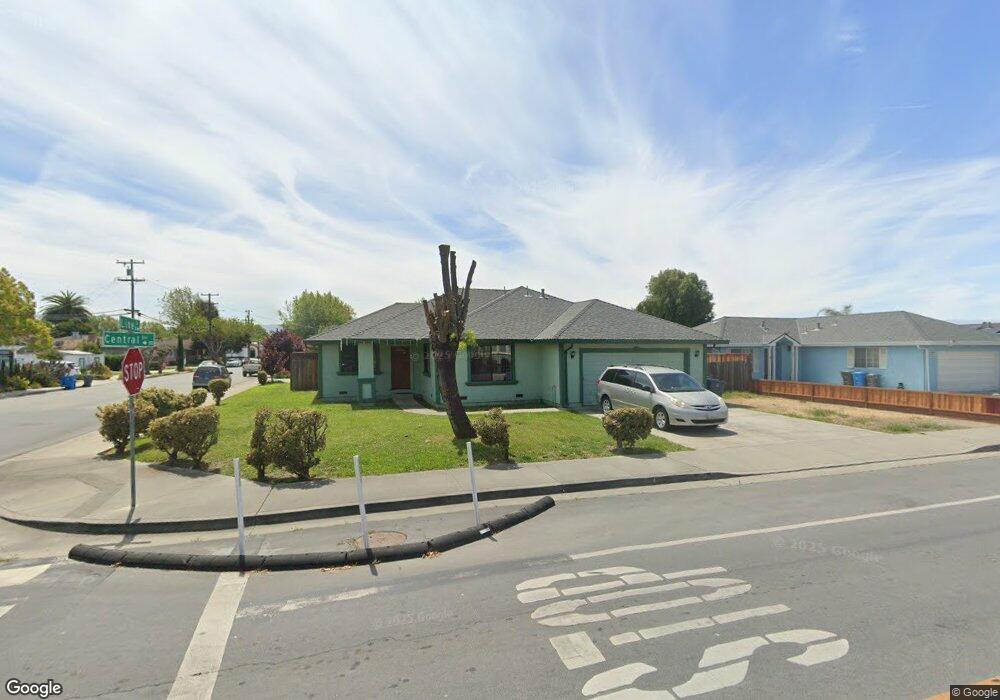
901 Central Ave Hollister, CA 95023
Estimated Value: $567,000 - $677,000
--
Bed
--
Bath
--
Sq Ft
7,971
Sq Ft Lot
About This Home
This home is located at 901 Central Ave, Hollister, CA 95023 and is currently estimated at $610,177. 901 Central Ave is a home located in San Benito County with nearby schools including Calaveras Elementary School, Maze Middle School, and San Benito High School.
Ownership History
Date
Name
Owned For
Owner Type
Purchase Details
Closed on
Apr 2, 2001
Sold by
Funderburg Amy F
Bought by
Funderburg David
Current Estimated Value
Home Financials for this Owner
Home Financials are based on the most recent Mortgage that was taken out on this home.
Original Mortgage
$234,400
Outstanding Balance
$87,502
Interest Rate
7.19%
Estimated Equity
$522,675
Purchase Details
Closed on
Jun 23, 1999
Sold by
Funderburg Amy Marie
Bought by
Funderburg David G
Home Financials for this Owner
Home Financials are based on the most recent Mortgage that was taken out on this home.
Original Mortgage
$203,000
Interest Rate
7.05%
Mortgage Type
VA
Purchase Details
Closed on
Jun 22, 1999
Sold by
Roy Zamaripa
Bought by
Funderburg David
Home Financials for this Owner
Home Financials are based on the most recent Mortgage that was taken out on this home.
Original Mortgage
$203,000
Interest Rate
7.05%
Mortgage Type
VA
Purchase Details
Closed on
Apr 2, 1999
Sold by
Avena Zamaripa Renee
Bought by
Zamaripa Roy
Create a Home Valuation Report for This Property
The Home Valuation Report is an in-depth analysis detailing your home's value as well as a comparison with similar homes in the area
Home Values in the Area
Average Home Value in this Area
Purchase History
| Date | Buyer | Sale Price | Title Company |
|---|---|---|---|
| Funderburg David | -- | Fidelity National Title Co | |
| Funderburg David G | -- | Fidelity National Title Ins | |
| Funderburg David | $203,000 | Fidelity National Title Ins | |
| Zamaripa Roy | -- | Fidelity National Title Ins |
Source: Public Records
Mortgage History
| Date | Status | Borrower | Loan Amount |
|---|---|---|---|
| Open | Funderburg David | $234,400 | |
| Closed | Funderburg David | $203,000 | |
| Closed | Funderburg David | $29,300 |
Source: Public Records
Tax History Compared to Growth
Tax History
| Year | Tax Paid | Tax Assessment Tax Assessment Total Assessment is a certain percentage of the fair market value that is determined by local assessors to be the total taxable value of land and additions on the property. | Land | Improvement |
|---|---|---|---|---|
| 2025 | $4,492 | $379,813 | $133,241 | $246,572 |
| 2023 | $4,492 | $365,067 | $128,068 | $236,999 |
| 2022 | $4,330 | $357,909 | $125,557 | $232,352 |
| 2021 | $4,269 | $350,893 | $123,096 | $227,797 |
| 2020 | $4,287 | $347,296 | $121,834 | $225,462 |
| 2019 | $4,161 | $340,488 | $119,446 | $221,042 |
| 2018 | $4,076 | $333,812 | $117,104 | $216,708 |
| 2017 | $4,020 | $327,267 | $114,808 | $212,459 |
| 2016 | $3,780 | $320,851 | $112,557 | $208,294 |
| 2015 | $3,743 | $316,033 | $110,867 | $205,166 |
| 2014 | $3,518 | $309,844 | $108,696 | $201,148 |
Source: Public Records
Map
Nearby Homes
- 101 Westside Blvd
- 500 Duran Dr
- 601 Chaparral Ct
- 713 7th St
- 805 South St Unit 3
- 805 South St Unit 17
- 1 Appletree Ln Unit 1
- 1261 South St
- 190 San Benito St
- 400 San Benito St Unit 309
- 400 San Benito St Unit 308
- 400 San Benito St Unit 202
- 400 San Benito St Unit 304
- 400 San Benito St Unit 212
- 400 San Benito St Unit 312
- 345 6th St
- 70 Chestnut Ln Unit 70
- 864 Powell St
- 435 San Benito St
- 220 4th St