901 County Road 398 Taylor, TX 76574
Estimated payment $73,596/month
Highlights
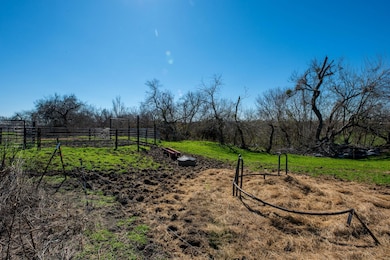
- Horses Allowed On Property
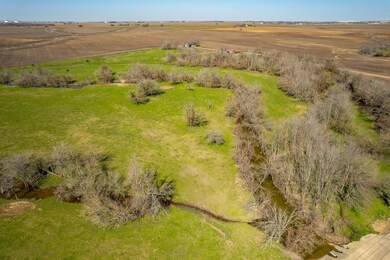
- Creek On Lot
- Pasture
- Waterfront
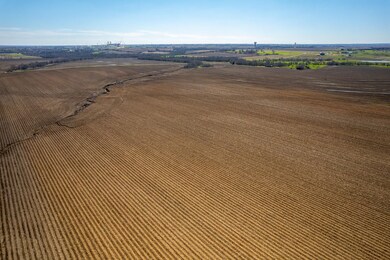
About This Lot
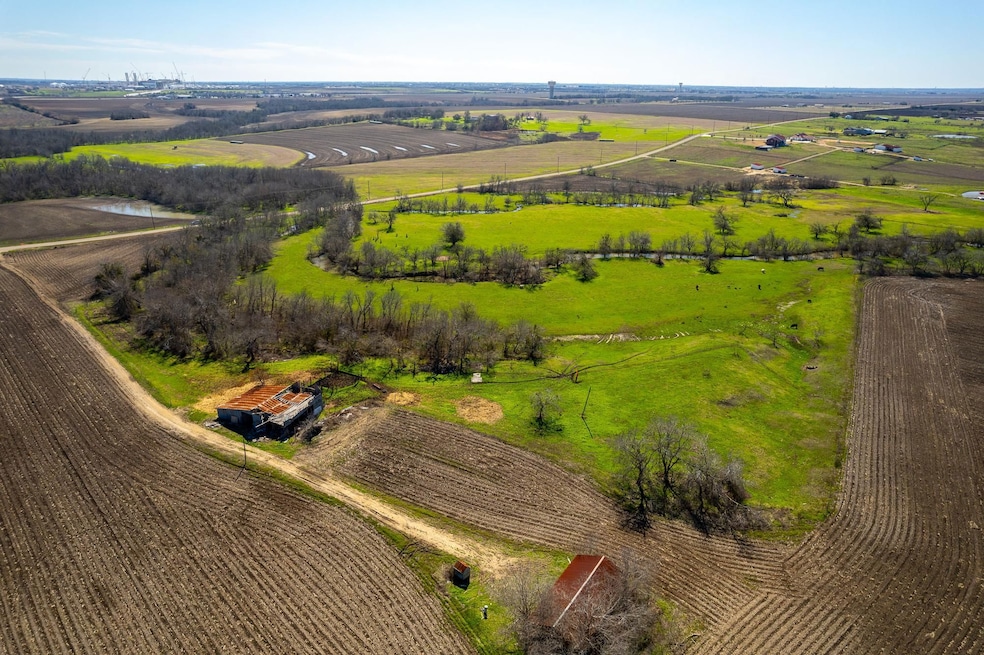
Fantastic opportunity to own 146.498 acres of land in Taylor's ETJ. This prime location offers close proximity to major roadways, downtown Taylor, the local airport, and the Samsung hub. Electric and water utilities are on the property or nearby. Wastewater line is being proposed to serve the area. No zoning in place.

Property Details
Property Type
- Land
Lot Details
- Waterfront
- Electric Fence
- Few Trees
- Potential uses include agriculture, commercial, for development
- Soil Types include Black
Additional Features
- Creek On Lot
- Pasture
- Horses Allowed On Property
- 1 Water Well
Map
Home Values in the Area
Average Home Value in this Area
Tax History
We collect this data history from publicly available records. To have your information removed, we recommend requesting removal directly through your county’s website.
| Year | Tax Paid | Tax Assessment Tax Assessment Total Assessment is a certain percentage of the fair market value that is determined by local assessors to be the total taxable value of land and additions on the property. | Land | Improvement |
|---|---|---|---|---|
| 2025 | $938 | $62,771 | -- | -- |
| 2024 | $938 | $61,826 | -- | -- |
| 2023 | $1,016 | $68,013 | $0 | $0 |
| 2022 | $766 | $45,636 | $0 | $0 |
| 2021 | $700 | $37,185 | $1,657,191 | $2,020 |
| 2020 | $534 | $27,424 | $811,975 | $1,919 |
| 2019 | $703 | $34,644 | $929,500 | $2,020 |
| 2018 | $1,002 | $49,405 | $929,500 | $2,020 |
| 2017 | $1,066 | $52,069 | $929,500 | $2,020 |
| 2016 | $1,461 | $71,398 | $929,500 | $2,020 |
| 2015 | $1,373 | $70,160 | $929,500 | $2,020 |
| 2014 | $1,373 | $70,905 | $0 | $0 |
Property History
We collect this data history from publicly available records. To have your information removed, we recommend requesting removal directly through your county’s website.
| Date | Event | Price | List to Sale | Price per Sq Ft |
|---|---|---|---|---|
| 02/05/2026 02/05/26 | For Sale | $13,624,314 | 0.0% | -- |
| 08/29/2025 08/29/25 | Pending | -- | -- | -- |
| 03/05/2024 03/05/24 | For Sale | $13,624,314 | -- | -- |
Purchase History
We collect this data history from publicly available records. To have your information removed, we recommend requesting removal directly through your county’s website.
| Date | Type | Sale Price | Title Company |
|---|---|---|---|
| Interfamily Deed Transfer | -- | Attorney |
- 901 County Road 398
- NA Fm-397 Carlos Parker
- 151 County Road 398
- 1420 County Road 373
- R019628 Old Georgetown Rd
- 2607 Cherrylawn Dr
- 148 Pivot Dr
- 2206 Canvas Back Dr
- 2204 Brewers Place
- 125 Janice
- 1915 T H Johnson Dr
- 168 Onna St
- 160 Gunther Way
- 144 Gunther Way
- 184 Gunther Way
- 2100 Oaklawn Dr
- 2200 Lark Ln
- 1906 Meadow Ridge Dr
- 225 Gunther Way
- 1910 Oaklawn Dr
- 200 Janice Rd
- 184 Gunther Way
- 2005 Whistling Way
- 1717 T H Johnson
- 230 Debus Dr
- 319 Sloan St
- 230 S Dr
- 404 Sloan St Unit SI ID1492690P
- 1800 Grace St
- 405 Sloan St
- 211 Tribute Blvd Unit Front Main Unit
- 108 Hartson Dr
- 120 Hartson Dr
- 514 Wyeth St
- 1011 Gilmore St
- 2804 Bull Run Unit B
- 2800 Bull Run Unit 705
- 2800 Bull Run Unit 704
- 313 Carlos G Parker Blvd NW
- 1012 Speegle St
Ask me questions while you tour the home.