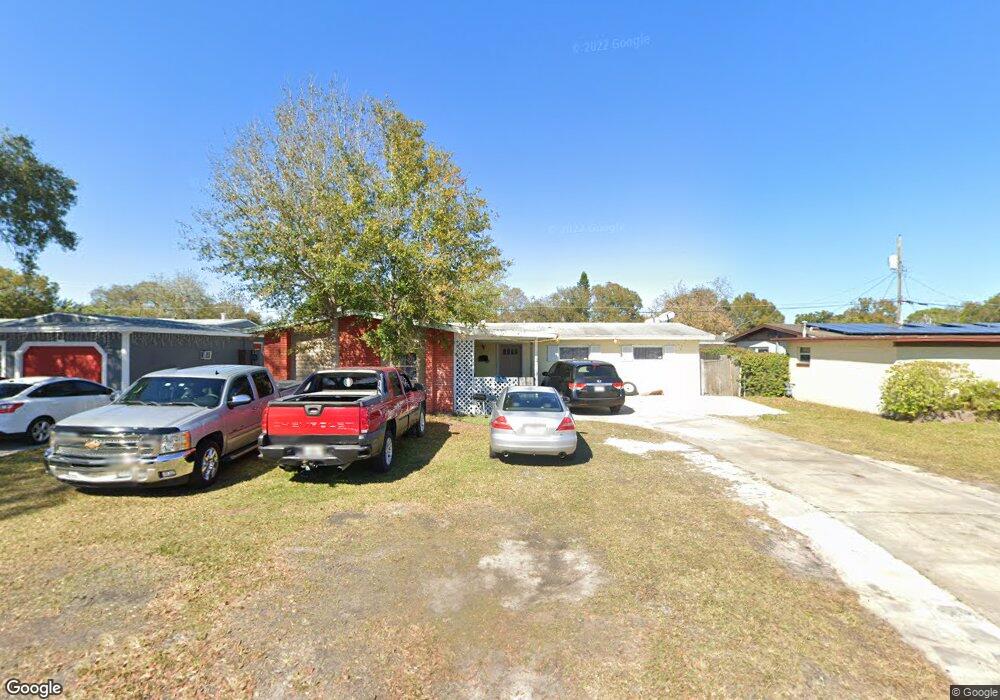
901 Doss Ave Orlando, FL 32809
Estimated Value: $296,000 - $337,248
3
Beds
2
Baths
1,790
Sq Ft
$181/Sq Ft
Est. Value
About This Home
This home is located at 901 Doss Ave, Orlando, FL 32809 and is currently estimated at $324,312, approximately $181 per square foot. 901 Doss Ave is a home located in Orange County with nearby schools including Sadler Elementary School, Judson B Walker Middle School, and Oak Ridge High School.
Ownership History
Date
Name
Owned For
Owner Type
Purchase Details
Closed on
Sep 22, 2009
Sold by
South Star Equity Holdings Inc
Bought by
Santana Ernesto and Rodriguez Claudia
Current Estimated Value
Purchase Details
Closed on
Sep 11, 2009
Sold by
The Bank Of New York
Bought by
South Star Equity Holdings Inc
Purchase Details
Closed on
Aug 8, 2009
Sold by
Ho Hung Hoang and Mai Kieu Thi
Bought by
The Bank Of New York
Purchase Details
Closed on
Aug 22, 2001
Sold by
Greg A Sorum I
Bought by
Ho Hung H and Ho Keiu T
Home Financials for this Owner
Home Financials are based on the most recent Mortgage that was taken out on this home.
Original Mortgage
$99,800
Interest Rate
7.18%
Mortgage Type
New Conventional
Purchase Details
Closed on
Aug 27, 1999
Sold by
Japaco Inc
Bought by
Rogwitz Joseph and Rutledge Amanda
Home Financials for this Owner
Home Financials are based on the most recent Mortgage that was taken out on this home.
Original Mortgage
$60,000
Interest Rate
7.58%
Mortgage Type
New Conventional
Create a Home Valuation Report for This Property
The Home Valuation Report is an in-depth analysis detailing your home's value as well as a comparison with similar homes in the area
Home Values in the Area
Average Home Value in this Area
Purchase History
| Date | Buyer | Sale Price | Title Company |
|---|---|---|---|
| Santana Ernesto | $49,000 | Southeast Professional Ti | |
| South Star Equity Holdings Inc | $45,000 | First International Title | |
| The Bank Of New York | -- | Attorney | |
| Ho Hung H | $102,900 | -- | |
| Rogwitz Joseph | $60,000 | -- | |
| Japaco Inc | $55,000 | -- |
Source: Public Records
Mortgage History
| Date | Status | Borrower | Loan Amount |
|---|---|---|---|
| Previous Owner | Japaco Inc | $99,800 | |
| Previous Owner | Japaco Inc | $60,000 |
Source: Public Records
Tax History Compared to Growth
Tax History
| Year | Tax Paid | Tax Assessment Tax Assessment Total Assessment is a certain percentage of the fair market value that is determined by local assessors to be the total taxable value of land and additions on the property. | Land | Improvement |
|---|---|---|---|---|
| 2025 | $3,511 | $151,411 | -- | -- |
| 2024 | $3,178 | $151,411 | -- | -- |
| 2023 | $3,178 | $263,360 | $80,000 | $183,360 |
| 2022 | $2,739 | $215,765 | $60,000 | $155,765 |
| 2021 | $2,430 | $176,050 | $50,000 | $126,050 |
| 2020 | $2,214 | $168,413 | $40,000 | $128,413 |
| 2019 | $2,179 | $158,323 | $40,000 | $118,323 |
| 2018 | $1,939 | $131,919 | $30,000 | $101,919 |
| 2017 | $1,745 | $112,354 | $25,000 | $87,354 |
| 2016 | $1,689 | $110,820 | $20,000 | $90,820 |
| 2015 | $1,454 | $83,142 | $20,000 | $63,142 |
| 2014 | $1,287 | $62,466 | $18,000 | $44,466 |
Source: Public Records
Map
Nearby Homes
- 849 Iron Oak Dr
- 840 Grey Oak Ct
- 819 Royal Oak Dr
- 6007 Woods St
- 6003 Woods St
- 5870 Cypress Shores Ct
- 933 W Oak Ridge Rd Unit 933B
- 801 Quintilian Ave
- 840 Plato Ave
- 5801 Chipola Cir
- 643 W Oak Ridge Rd
- 541 Trellis Ct Unit A
- 5830 Trinity Ln
- 5619 Padgett Cir
- 5625 Chipola Cir
- 5497 Alandale Ct
- 1665 W Oak Ridge Rd Unit D
- 6052 Nashua Ave
- 6043 Nashua Ave
- 430 Bywater Dr