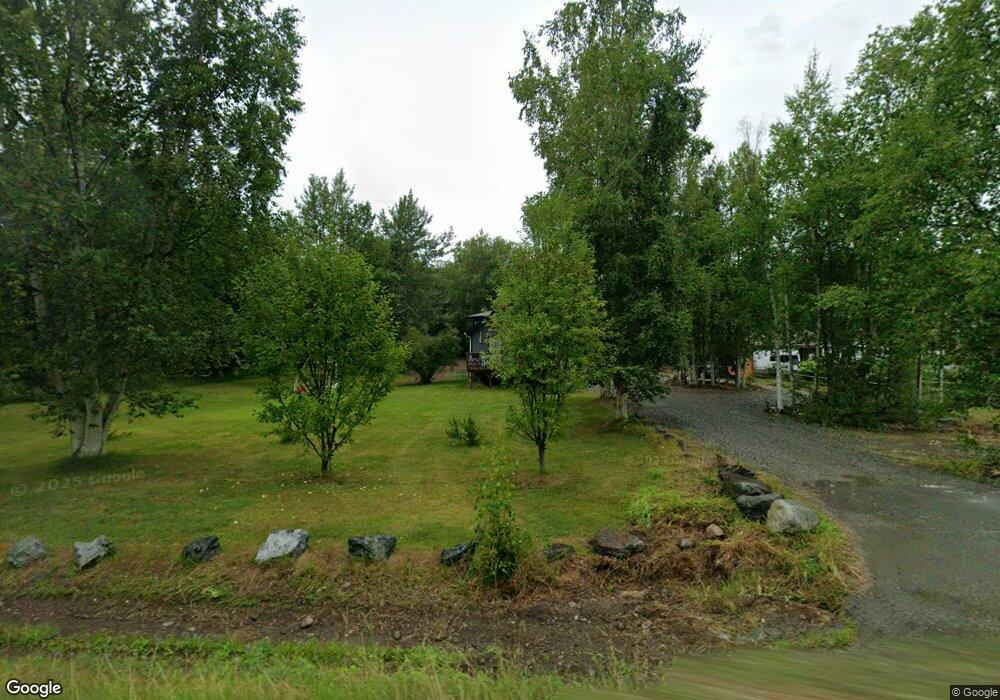
901 E Fairview Loop Wasilla, AK 99654
Estimated Value: $270,000 - $349,012
3
Beds
2
Baths
1,200
Sq Ft
$267/Sq Ft
Est. Value
About This Home
This home is located at 901 E Fairview Loop, Wasilla, AK 99654 and is currently estimated at $320,003, approximately $266 per square foot. 901 E Fairview Loop is a home located in Matanuska-Susitna Borough with nearby schools including Snowshoe Elementary School, Wasilla Middle School, and Wasilla High School.
Ownership History
Date
Name
Owned For
Owner Type
Purchase Details
Closed on
Nov 27, 2006
Sold by
Lyon Jason R and Lyon Evelyn L
Bought by
Downs Christopher and Downs Morgen
Current Estimated Value
Home Financials for this Owner
Home Financials are based on the most recent Mortgage that was taken out on this home.
Original Mortgage
$32,000
Interest Rate
6.37%
Mortgage Type
Stand Alone Second
Purchase Details
Closed on
Nov 22, 2002
Sold by
Johnson Lois J and Clague Lois J
Bought by
Lyon Jason R and Lyon Evelyn L
Home Financials for this Owner
Home Financials are based on the most recent Mortgage that was taken out on this home.
Original Mortgage
$119,059
Interest Rate
6.12%
Mortgage Type
FHA
Purchase Details
Closed on
Jun 17, 2002
Sold by
Clague John Roger
Bought by
Johnson Lois J and Clague Lois J
Create a Home Valuation Report for This Property
The Home Valuation Report is an in-depth analysis detailing your home's value as well as a comparison with similar homes in the area
Home Values in the Area
Average Home Value in this Area
Purchase History
| Date | Buyer | Sale Price | Title Company |
|---|---|---|---|
| Downs Christopher | -- | First American Title Ins Co | |
| Lyon Jason R | -- | Mat Su Title Insurance Agenc | |
| Johnson Lois J | -- | -- |
Source: Public Records
Mortgage History
| Date | Status | Borrower | Loan Amount |
|---|---|---|---|
| Closed | Downs Christopher | $32,000 | |
| Open | Downs Christopher | $128,000 | |
| Previous Owner | Lyon Jason R | $119,059 | |
| Closed | Lyon Jason R | $4,762 |
Source: Public Records
Tax History
| Year | Tax Paid | Tax Assessment Tax Assessment Total Assessment is a certain percentage of the fair market value that is determined by local assessors to be the total taxable value of land and additions on the property. | Land | Improvement |
|---|---|---|---|---|
| 2025 | $2,395 | $318,100 | $34,000 | $284,100 |
| 2024 | $2,395 | $192,000 | $34,000 | $158,000 |
| 2023 | $2,272 | $186,500 | $34,000 | $152,500 |
| 2022 | $2,199 | $169,400 | $34,000 | $135,400 |
| 2021 | $2,170 | $151,000 | $34,000 | $117,000 |
| 2020 | $2,117 | $142,700 | $34,000 | $108,700 |
| 2019 | $2,043 | $136,600 | $34,000 | $102,600 |
| 2018 | $2,013 | $133,800 | $34,000 | $99,800 |
| 2017 | $1,902 | $127,800 | $34,000 | $93,800 |
| 2016 | $1,870 | $128,900 | $34,000 | $94,900 |
| 2015 | $1,872 | $119,000 | $25,200 | $93,800 |
| 2014 | $1,872 | $116,400 | $25,200 | $91,200 |
Source: Public Records
Map
Nearby Homes
- 1130 E Chugach View Dr
- 1300 E Holland Ave
- 308 E Birchtree Dr
- 205 W Pennington Place
- 3700 S Krisun Dr
- 3701 S Well Site Rd
- 174 E Leota St
- 392 W Dorothy Jean Dr
- 4681 E Fairview Loop
- 765 W Jones Dr
- 157 Hardrock Cir
- 962 W Berry Cir
- 1090 W Bluff View Dr
- 1200 S Thomas St
- 1890 S Endeavor St
- 488 W Goldenwood St
- 7503 S Knik Goose Bay Rd
- 1160 S Century Dr
- 3097 E Akutan Ave
- 1000 S Century Dr
- 911 E Fairview Loop
- 921 E Fairview Loop
- 924 E Chugach View Dr
- 931 E Fairview Loop
- 974 E Chugach View Dr
- 3601 S Jackson Ct
- 3600 S Jackson Ct
- 1100 S Chugach St
- 801 E Fairview Loop
- 941 E Fairview Loop
- 1000 E Chugach View Dr
- 901 E Chugach View Dr
- 1131 E Chugach View Dr
- 1161 E Chugach View Dr
- 1024 E Chugach View Dr
- 951 E Fairview Loop
- 900 E Fairview Loop
- 1001 E Chugach View Dr
- 3700 S Jackson Ct
- 3320 Michelle Ln
Your Personal Tour Guide
Ask me questions while you tour the home.