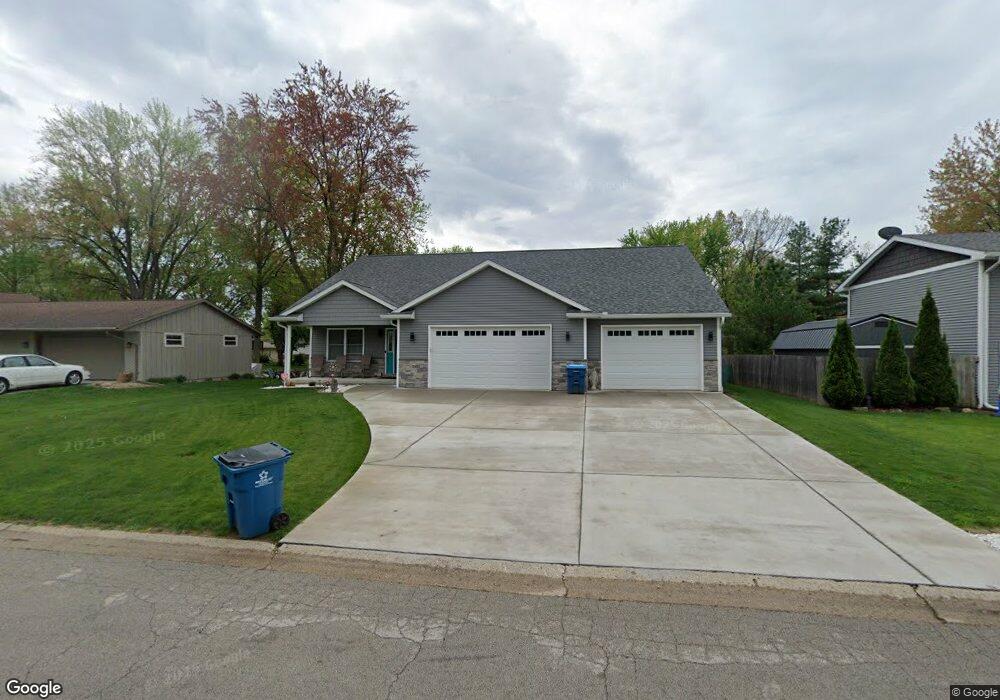
901 Flaggland Dr Unit 1 Sherman, IL 62684
Estimated Value: $268,000 - $336,000
4
Beds
2
Baths
1,820
Sq Ft
$167/Sq Ft
Est. Value
About This Home
This home is located at 901 Flaggland Dr Unit 1, Sherman, IL 62684 and is currently estimated at $303,150, approximately $166 per square foot. 901 Flaggland Dr Unit 1 is a home located in Sangamon County with nearby schools including Sherman Elementary School, Williamsville Jr High School, and Williamsville High School.
Ownership History
Date
Name
Owned For
Owner Type
Purchase Details
Closed on
Mar 10, 2021
Sold by
Reese Langheim
Bought by
Beal Bruce and Beal Michelle
Current Estimated Value
Purchase Details
Closed on
Dec 24, 2020
Sold by
Marie Trueblood Angela and Marie Garrett L
Bought by
Langheim Reese N
Purchase Details
Closed on
Nov 26, 2012
Purchase Details
Closed on
Jul 18, 2005
Purchase Details
Closed on
Feb 25, 2003
Create a Home Valuation Report for This Property
The Home Valuation Report is an in-depth analysis detailing your home's value as well as a comparison with similar homes in the area
Home Values in the Area
Average Home Value in this Area
Purchase History
| Date | Buyer | Sale Price | Title Company |
|---|---|---|---|
| Beal Bruce | $35,000 | -- | |
| Langheim Reese N | $10,000 | -- | |
| -- | -- | -- | |
| -- | -- | -- | |
| -- | $102,000 | -- |
Source: Public Records
Tax History Compared to Growth
Tax History
| Year | Tax Paid | Tax Assessment Tax Assessment Total Assessment is a certain percentage of the fair market value that is determined by local assessors to be the total taxable value of land and additions on the property. | Land | Improvement |
|---|---|---|---|---|
| 2024 | $6,870 | $109,452 | $14,205 | $95,247 |
| 2023 | $6,600 | $13,139 | $13,139 | $0 |
| 2022 | $877 | $12,238 | $12,238 | $0 |
| 2021 | $511 | $6,868 | $6,868 | $0 |
| 2020 | $499 | $6,726 | $6,726 | $0 |
| 2019 | $3,178 | $49,976 | $6,675 | $43,301 |
| 2018 | $3,106 | $49,688 | $6,637 | $43,051 |
| 2017 | $3,019 | $49,142 | $6,564 | $42,578 |
| 2016 | $2,954 | $47,967 | $6,407 | $41,560 |
| 2015 | $2,882 | $47,343 | $6,324 | $41,019 |
| 2014 | $2,786 | $45,592 | $6,090 | $39,502 |
| 2013 | $2,756 | $44,976 | $6,008 | $38,968 |
Source: Public Records
Map
Nearby Homes
- 716 Old Tipton School Rd Unit 1
- 1100 Lightstone Ct
- 4 Red Bud Run
- 0 S Sherman Blvd
- 1109 Lightstone Ct
- 355 Turtle Dove Dr
- 710 Timber Edge Dr
- 255 Possum Pass Ct
- 105 Illini Blvd
- 101 Illini Blvd
- 1201 Saratoga Chase
- 1215 Golf Crest Ct
- 1237 Golf Crest Ct
- 1309 Arlington Chase
- 20 Hickory Ridge Ln Unit 1
- 0 Cabin Smoke Trail
- 40 Woods Mill Rd
- 4600 Bachmann Dr
- 20 Bent Creek Rd
- 5 Marys Cove
- 905 Flaggland Dr Unit 1
- 823 Flaggland Dr Unit 1
- 909 Flaggland Dr Unit 1
- 409 Westhampton Unit 1
- 501 Vanderbilt Unit 1
- 824 Flaggland Dr Unit 1
- 505 Vanderbilt Unit 1
- 904 Flaggland Dr Unit 1
- 509 Vanderbilt Unit 1
- 913 Flaggland Dr Unit 1
- 500 Old Tipton School Rd
- 820 Flaggland Dr Unit 1
- 405 Westhampton Unit 1
- 406 Westhampton Unit 1
- 908 Flaggland Dr Unit 1
- 511 Vanderbilt Unit 1
- 815 Flaggland Dr Unit 1
- 400 Old Tipton School Rd
- 816 Flaggland Dr Unit 1
- 504 Vanderbilt Unit 1