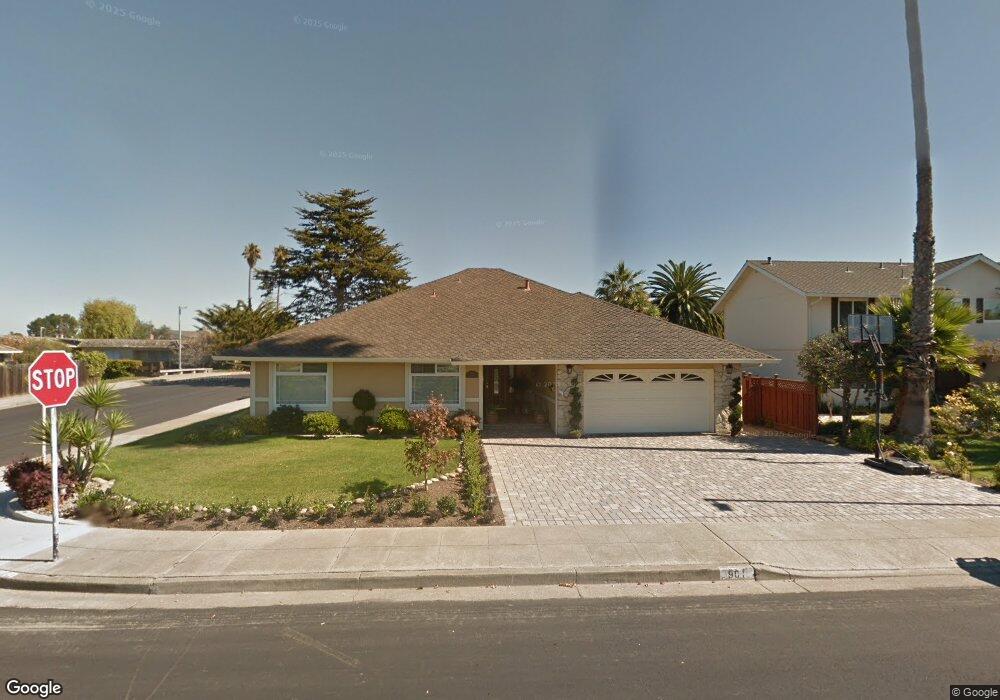
901 Lurline Dr Foster City, CA 94404
Treasure Isle NeighborhoodEstimated Value: $2,163,000 - $2,385,000
4
Beds
2
Baths
2,230
Sq Ft
$1,037/Sq Ft
Est. Value
About This Home
This home is located at 901 Lurline Dr, Foster City, CA 94404 and is currently estimated at $2,312,524, approximately $1,037 per square foot. 901 Lurline Dr is a home located in San Mateo County with nearby schools including Brewer Island Elementary School, Bowditch Middle School, and San Mateo High School.
Ownership History
Date
Name
Owned For
Owner Type
Purchase Details
Closed on
Aug 28, 2006
Sold by
Ramezanbeigi Jahangir and Ramezanbeigi Mina
Bought by
Ramezanbeigi Jahangir and Ramezanbeigi Mina
Current Estimated Value
Purchase Details
Closed on
Dec 21, 1999
Sold by
Virinder Nayyar
Bought by
Ramezanbeigi Jahangir and Ramezanbeigi Mina
Home Financials for this Owner
Home Financials are based on the most recent Mortgage that was taken out on this home.
Original Mortgage
$320,000
Outstanding Balance
$92,702
Interest Rate
6.87%
Estimated Equity
$2,219,822
Purchase Details
Closed on
May 9, 1995
Sold by
Foster Sara B
Bought by
Nayyar Virinder and Nayyar Rita
Home Financials for this Owner
Home Financials are based on the most recent Mortgage that was taken out on this home.
Original Mortgage
$308,850
Interest Rate
7.75%
Purchase Details
Closed on
Nov 21, 1994
Sold by
Resolution Trust Corp
Bought by
Resolution Trust Corp
Create a Home Valuation Report for This Property
The Home Valuation Report is an in-depth analysis detailing your home's value as well as a comparison with similar homes in the area
Home Values in the Area
Average Home Value in this Area
Purchase History
| Date | Buyer | Sale Price | Title Company |
|---|---|---|---|
| Ramezanbeigi Jahangir | -- | None Available | |
| Ramezanbeigi Jahangir | $625,000 | Fidelity National Title Co | |
| Nayyar Virinder | $184,000 | Commonwealth Land Title | |
| Resolution Trust Corp | $178,500 | North American Title Insuran |
Source: Public Records
Mortgage History
| Date | Status | Borrower | Loan Amount |
|---|---|---|---|
| Open | Ramezanbeigi Jahangir | $320,000 | |
| Previous Owner | Nayyar Virinder | $308,850 |
Source: Public Records
Tax History Compared to Growth
Tax History
| Year | Tax Paid | Tax Assessment Tax Assessment Total Assessment is a certain percentage of the fair market value that is determined by local assessors to be the total taxable value of land and additions on the property. | Land | Improvement |
|---|---|---|---|---|
| 2025 | $11,359 | $960,590 | $480,295 | $480,295 |
| 2023 | $11,359 | $923,292 | $461,646 | $461,646 |
| 2022 | $10,975 | $905,190 | $452,595 | $452,595 |
| 2021 | $10,830 | $887,442 | $443,721 | $443,721 |
| 2020 | $10,535 | $878,344 | $439,172 | $439,172 |
| 2019 | $9,985 | $861,122 | $430,561 | $430,561 |
| 2018 | $9,515 | $844,238 | $422,119 | $422,119 |
| 2017 | $9,409 | $827,686 | $413,843 | $413,843 |
| 2016 | $9,420 | $811,458 | $405,729 | $405,729 |
| 2015 | $9,201 | $799,270 | $399,635 | $399,635 |
| 2014 | $8,968 | $783,614 | $391,807 | $391,807 |
Source: Public Records
Map
Nearby Homes
- 1074 Eagle Ln
- 1336 Marlin Ave
- 1351 Marlin Ave
- 241 Bonita Ln
- 650 Pilgrim Dr
- 370 Bramble Ct
- 1131 Compass Ln Unit 108
- 224 Loon Ct
- 3206 Admiralty Ln
- 1102 Admiralty Ln
- 1028 Foster Square Ln Unit 305
- 1081 Beach Park Blvd Unit 206
- 769 Eppleton Ln Unit 302
- 1061 Beach Park Blvd Unit 216
- 708 Thayer Ln Unit 404
- 822 Magellan Ln
- 1171 Compass Ln Unit 211
- 926 Lido Ln
- 825 Cortez Ln
- 1018 Lido Ln
- 905 Lurline Dr
- 897 Lurline Dr
- 150 Shooting Star Isle
- 909 Lurline Dr
- 164 Shooting Star Isle
- 900 Lurline Dr
- 166 Shooting Star Isle
- 906 Lurline Dr
- 893 Lurline Dr
- 148 Shooting Star Isle
- 896 Lurline Dr
- 915 Lurline Dr
- 910 Lurline Dr
- 168 Shooting Star Isle
- 142 Shooting Star Isle
- 889 Lurline Dr
- 888 Lurline Dr
- 901 Constitution Dr
- 914 Lurline Dr
- 172 Shooting Star Isle