901 N G St Oxnard, CA 93030
Carriage Square NeighborhoodEstimated Value: $764,000 - $939,000
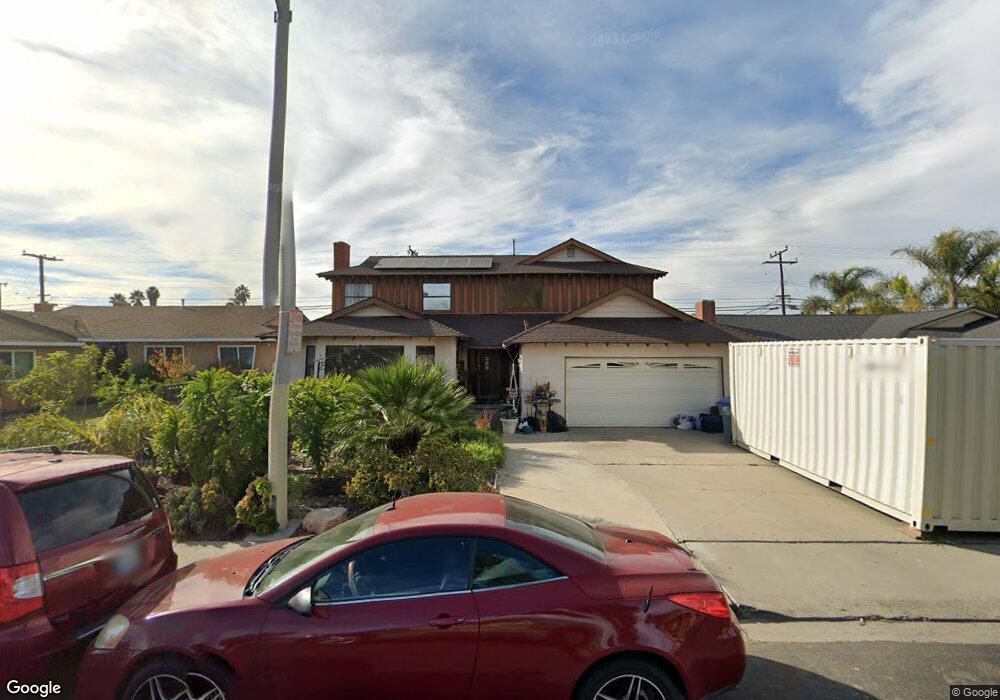
About This Home
This home is located at 901 N G St, Oxnard, CA 93030 and is currently estimated at $877,816, approximately $309 per square foot. 901 N G St is a home located in Ventura County with nearby schools including Curren School, Pacifica High School, and Vista Real Charter High School.
Ownership History
We collect this data history from publicly available records. To have your information removed, we recommend requesting removal directly through your county’s website.
Purchase Details
Home Financials for this Owner
Home Financials are based on the most recent Mortgage that was taken out on this home.Purchase Details
Purchase Details
Purchase Details
Home Financials for this Owner
Home Financials are based on the most recent Mortgage that was taken out on this home.Home Values in the Area
Average Home Value in this Area
Purchase History
We collect this data history from publicly available records. To have your information removed, we recommend requesting removal directly through your county’s website.
| Date | Buyer | Sale Price | Title Company |
|---|---|---|---|
| -- | Title Court | ||
| -- | Fidelity National Title Co | ||
| $230,000 | Fidelity National Title Co | ||
| $195,000 | First American Title Ins Co |
Mortgage History
We collect this data history from publicly available records. To have your information removed, we recommend requesting removal directly through your county’s website.
| Date | Status | Borrower | Loan Amount |
|---|---|---|---|
| Open | $100,000 | ||
| Previous Owner | $146,250 |
Tax History
We collect this data history from publicly available records. To have your information removed, we recommend requesting removal directly through your county’s website.
| Year | Tax Paid | Tax Assessment Tax Assessment Total Assessment is a certain percentage of the fair market value that is determined by local assessors to be the total taxable value of land and additions on the property. | Land | Improvement |
|---|---|---|---|---|
| 2025 | $8,959 | $360,547 | $133,243 | $227,304 |
| 2024 | $8,959 | $353,478 | $130,630 | $222,848 |
| 2023 | $8,801 | $346,548 | $128,069 | $218,479 |
| 2022 | $8,675 | $339,753 | $125,557 | $214,196 |
| 2021 | $8,642 | $333,092 | $123,095 | $209,997 |
| 2020 | $8,715 | $329,679 | $121,834 | $207,845 |
| 2019 | $8,587 | $323,216 | $119,446 | $203,770 |
| 2018 | $8,530 | $316,879 | $117,104 | $199,775 |
| 2017 | $8,331 | $310,666 | $114,808 | $195,858 |
| 2016 | $8,201 | $304,575 | $112,557 | $192,018 |
| 2015 | $8,249 | $300,002 | $110,867 | $189,135 |
| 2014 | $3,564 | $294,128 | $108,697 | $185,431 |
Map
- 1220 W Robert Ave
- 800 S A St
- 700 N M St
- 1315 Devonshire Dr
- 1331 Edgewood Way
- 1335 Edgewood Way
- 1341 Edgewood Way Unit 23
- 729 Ivywood Dr
- 1310 N M St
- 1357 Edgewood Way
- 307 N F St Unit 102
- 620 Janetwood Dr
- 1430 Huntswood Way
- 448 Palm Dr
- 137 W 1st St
- 620 W Gonzales Rd
- 620 W Gonzales Rd Unit B
- 620 W Gonzales Rd Unit C
- 620 W Gonzales Rd Unit D
- 620 W Gonzales Rd Unit A
Ask me questions while you tour the home.