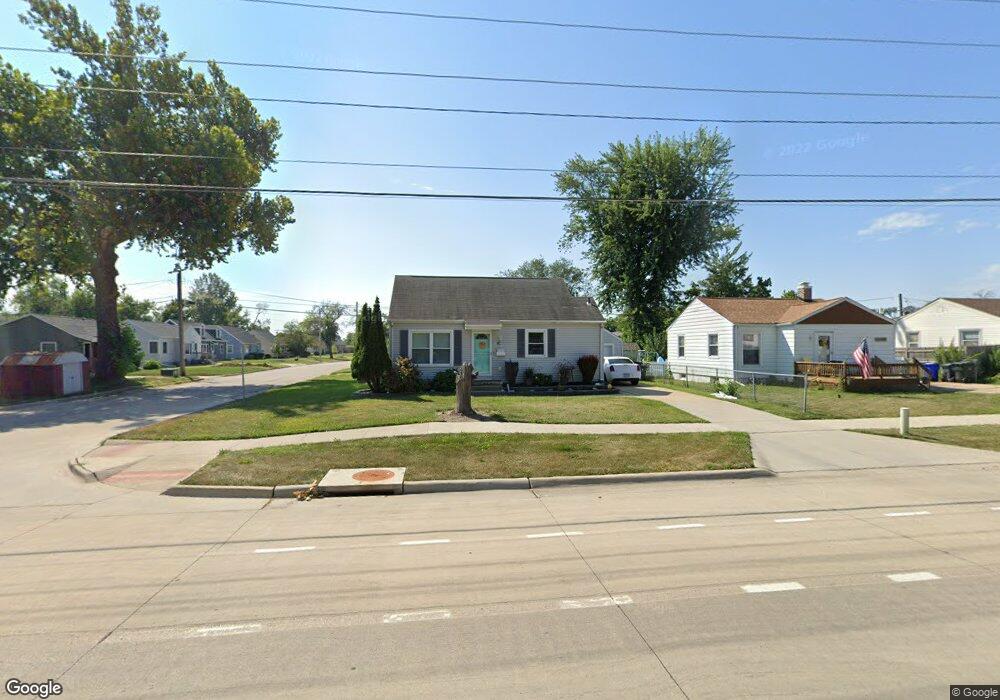
901 O Ave NW Cedar Rapids, IA 52405
Northwest Area NeighborhoodEstimated Value: $138,791 - $173,000
2
Beds
2
Baths
726
Sq Ft
$212/Sq Ft
Est. Value
About This Home
This home is located at 901 O Ave NW, Cedar Rapids, IA 52405 and is currently estimated at $154,198, approximately $212 per square foot. 901 O Ave NW is a home located in Linn County with nearby schools including Harrison Elementary School, Roosevelt Creative Corridor Business Academy, and John F. Kennedy High School.
Ownership History
Date
Name
Owned For
Owner Type
Purchase Details
Closed on
Nov 8, 2018
Sold by
Bailey Debra Lynn
Bought by
Mertz Elizabeth M and Schmidt Laura M
Current Estimated Value
Home Financials for this Owner
Home Financials are based on the most recent Mortgage that was taken out on this home.
Original Mortgage
$103,500
Outstanding Balance
$92,297
Interest Rate
5.62%
Mortgage Type
Adjustable Rate Mortgage/ARM
Estimated Equity
$61,901
Purchase Details
Closed on
Aug 11, 2003
Sold by
Meier Jason A and Meier Jennifer C
Bought by
Bailey Debra Lynn
Home Financials for this Owner
Home Financials are based on the most recent Mortgage that was taken out on this home.
Original Mortgage
$84,584
Interest Rate
5.31%
Mortgage Type
Unknown
Purchase Details
Closed on
Nov 19, 1998
Sold by
Kaliban Brian Dean
Bought by
Meier Jason A and Larsen Jennifer C
Home Financials for this Owner
Home Financials are based on the most recent Mortgage that was taken out on this home.
Original Mortgage
$61,650
Interest Rate
6.59%
Create a Home Valuation Report for This Property
The Home Valuation Report is an in-depth analysis detailing your home's value as well as a comparison with similar homes in the area
Home Values in the Area
Average Home Value in this Area
Purchase History
| Date | Buyer | Sale Price | Title Company |
|---|---|---|---|
| Mertz Elizabeth M | $115,000 | None Available | |
| Bailey Debra Lynn | $87,000 | -- | |
| Meier Jason A | $68,000 | -- |
Source: Public Records
Mortgage History
| Date | Status | Borrower | Loan Amount |
|---|---|---|---|
| Open | Mertz Elizabeth M | $103,500 | |
| Previous Owner | Bailey Debra Lynn | $84,584 | |
| Previous Owner | Meier Jason A | $61,650 |
Source: Public Records
Tax History
| Year | Tax Paid | Tax Assessment Tax Assessment Total Assessment is a certain percentage of the fair market value that is determined by local assessors to be the total taxable value of land and additions on the property. | Land | Improvement |
|---|---|---|---|---|
| 2025 | $1,976 | $133,400 | $28,000 | $105,400 |
| 2024 | $2,100 | $122,100 | $23,400 | $98,700 |
| 2023 | $2,100 | $122,100 | $23,400 | $98,700 |
| 2022 | $2,010 | $108,400 | $23,400 | $85,000 |
| 2021 | $2,158 | $106,000 | $21,000 | $85,000 |
| 2020 | $2,158 | $97,800 | $21,000 | $76,800 |
| 2019 | $1,790 | $91,600 | $18,700 | $72,900 |
Source: Public Records
Map
Nearby Homes
- 1620 9th St NW
- 1532 8th St NW
- 1625 11th St NW
- 820 M Ave NW
- 1621 13th St NW
- 1637 13th St NW
- 1238 Ellis Blvd NW
- 1121 11th St NW
- 1114 11th St NW
- 1525 N Ave NW
- 1871 Ellis Blvd NW Unit 202
- 1871 Ellis Blvd NW Unit 205
- 816 10th St NW
- 819 G Ave NW
- 1617 Whitters Way NW
- 718 4th St NW
- 1100 18th St NW
- 514 9th St NW
- 2210 O Ave NW
- 2237 Tranquil Ct NW
Your Personal Tour Guide
Ask me questions while you tour the home.