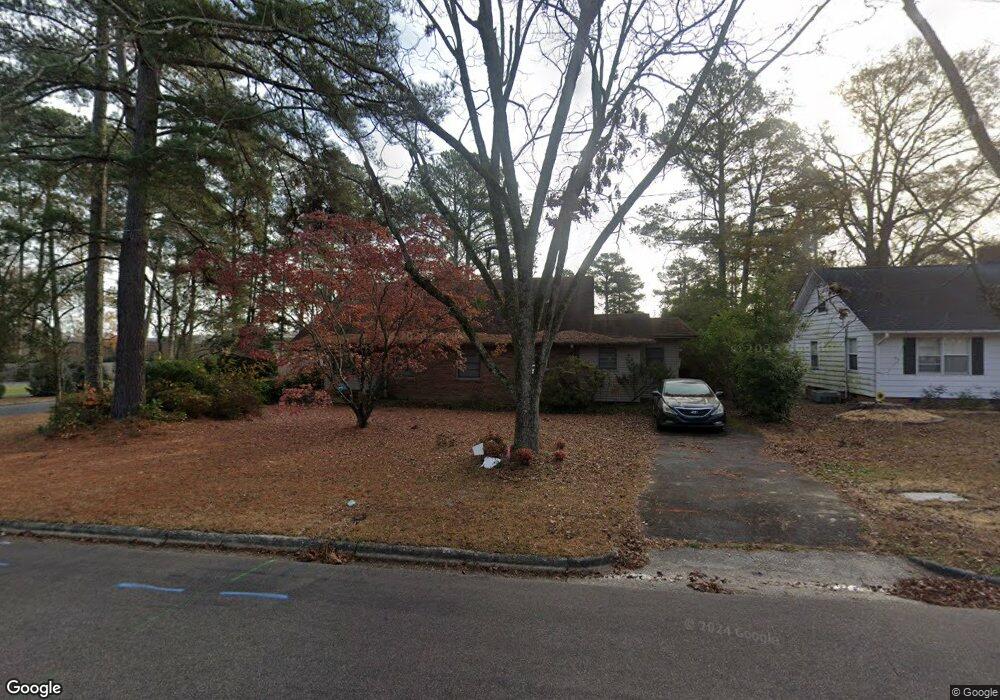
901 S 2nd St Smithfield, NC 27577
Estimated Value: $251,000 - $300,000
3
Beds
2
Baths
2,350
Sq Ft
$119/Sq Ft
Est. Value
About This Home
This home is located at 901 S 2nd St, Smithfield, NC 27577 and is currently estimated at $278,685, approximately $118 per square foot. 901 S 2nd St is a home located in Johnston County with nearby schools including South Smithfield Elementary School, Smithfield Middle School, and Smithfield-Selma High School.
Ownership History
Date
Name
Owned For
Owner Type
Purchase Details
Closed on
Jan 29, 2018
Sold by
Aycock Richard N
Bought by
Cook Cynthia K and Cook Robert T
Current Estimated Value
Home Financials for this Owner
Home Financials are based on the most recent Mortgage that was taken out on this home.
Original Mortgage
$130,077
Outstanding Balance
$106,778
Interest Rate
3.78%
Mortgage Type
New Conventional
Estimated Equity
$171,907
Purchase Details
Closed on
Oct 30, 2015
Sold by
Smithfield Aycock Land Llc
Bought by
Cook Cynthia K and Cook Robert T
Home Financials for this Owner
Home Financials are based on the most recent Mortgage that was taken out on this home.
Original Mortgage
$130,077
Interest Rate
3.89%
Mortgage Type
New Conventional
Purchase Details
Closed on
Nov 5, 2001
Sold by
Richard N Aycock Jr Rev Trst
Bought by
Aycock Richard N
Create a Home Valuation Report for This Property
The Home Valuation Report is an in-depth analysis detailing your home's value as well as a comparison with similar homes in the area
Home Values in the Area
Average Home Value in this Area
Purchase History
| Date | Buyer | Sale Price | Title Company |
|---|---|---|---|
| Cook Cynthia K | -- | None Available | |
| Cook Cynthia K | $126,500 | None Available | |
| Aycock Richard N | -- | -- |
Source: Public Records
Mortgage History
| Date | Status | Borrower | Loan Amount |
|---|---|---|---|
| Open | Cook Cynthia K | $130,077 | |
| Previous Owner | Cook Cynthia K | $130,077 |
Source: Public Records
Tax History
| Year | Tax Paid | Tax Assessment Tax Assessment Total Assessment is a certain percentage of the fair market value that is determined by local assessors to be the total taxable value of land and additions on the property. | Land | Improvement |
|---|---|---|---|---|
| 2025 | $2,232 | $230,100 | $80,000 | $150,100 |
| 2024 | $1,808 | $145,820 | $60,000 | $85,820 |
| 2023 | $1,837 | $145,820 | $60,000 | $85,820 |
| 2022 | $1,896 | $145,820 | $60,000 | $85,820 |
| 2021 | $1,896 | $145,820 | $60,000 | $85,820 |
| 2020 | $1,939 | $145,820 | $60,000 | $85,820 |
| 2019 | $1,939 | $145,820 | $60,000 | $85,820 |
| 2018 | $1,732 | $128,320 | $44,720 | $83,600 |
| 2017 | $1,732 | $128,320 | $44,720 | $83,600 |
| 2016 | $1,732 | $128,320 | $44,720 | $83,600 |
| 2015 | $1,732 | $128,320 | $44,720 | $83,600 |
| 2014 | $1,732 | $128,320 | $44,720 | $83,600 |
Source: Public Records
Map
Nearby Homes
Your Personal Tour Guide
Ask me questions while you tour the home.