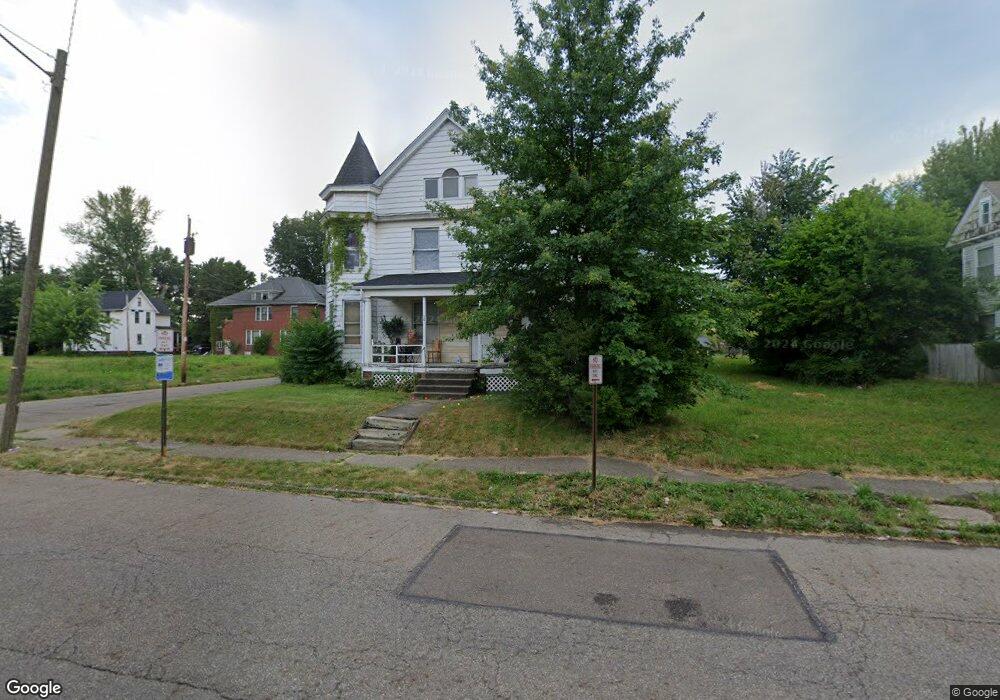
901 Shorb Ave NW Canton, OH 44703
Summit NeighborhoodEstimated Value: $95,000 - $121,000
3
Beds
3
Baths
2,310
Sq Ft
$46/Sq Ft
Est. Value
About This Home
This home is located at 901 Shorb Ave NW, Canton, OH 44703 and is currently estimated at $105,667, approximately $45 per square foot. 901 Shorb Ave NW is a home located in Stark County with nearby schools including Early Learning Center @ Schreiber, Gibbs Elementary School, and Clarendon Intermediate School.
Ownership History
Date
Name
Owned For
Owner Type
Purchase Details
Closed on
Feb 5, 2019
Bought by
Np Apartments Llc & Abel Frank
Current Estimated Value
Purchase Details
Closed on
Sep 20, 2018
Sold by
Teeple Joshua
Bought by
Papoulides Nicoletta
Purchase Details
Closed on
Feb 15, 2001
Sold by
Associates Home Equity Services Inc
Bought by
Abel Revecca
Home Financials for this Owner
Home Financials are based on the most recent Mortgage that was taken out on this home.
Original Mortgage
$33,750
Interest Rate
7.1%
Mortgage Type
Purchase Money Mortgage
Purchase Details
Closed on
Sep 1, 2000
Sold by
Douglas Carole R
Bought by
Associates Home Equity Services Inc
Purchase Details
Closed on
Mar 4, 1999
Sold by
Corlett Thomas P
Bought by
Douglas Carole R
Home Financials for this Owner
Home Financials are based on the most recent Mortgage that was taken out on this home.
Original Mortgage
$48,875
Interest Rate
6.8%
Mortgage Type
Purchase Money Mortgage
Create a Home Valuation Report for This Property
The Home Valuation Report is an in-depth analysis detailing your home's value as well as a comparison with similar homes in the area
Home Values in the Area
Average Home Value in this Area
Purchase History
| Date | Buyer | Sale Price | Title Company |
|---|---|---|---|
| Np Apartments Llc & Abel Frank | -- | -- | |
| Papoulides Nicoletta | -- | None Available | |
| Abel Revecca | $45,000 | -- | |
| Associates Home Equity Services Inc | -- | Tower City Title Agency Inc | |
| Douglas Carole R | $34,000 | Trident Title Agency |
Source: Public Records
Mortgage History
| Date | Status | Borrower | Loan Amount |
|---|---|---|---|
| Previous Owner | Abel Revecca | $33,750 | |
| Previous Owner | Douglas Carole R | $48,875 |
Source: Public Records
Tax History Compared to Growth
Tax History
| Year | Tax Paid | Tax Assessment Tax Assessment Total Assessment is a certain percentage of the fair market value that is determined by local assessors to be the total taxable value of land and additions on the property. | Land | Improvement |
|---|---|---|---|---|
| 2025 | -- | $27,720 | $3,500 | $24,220 |
| 2024 | -- | $27,720 | $3,500 | $24,220 |
| 2023 | $780 | $12,780 | $2,100 | $10,680 |
| 2022 | $762 | $12,780 | $2,100 | $10,680 |
| 2021 | $770 | $12,780 | $2,100 | $10,680 |
| 2020 | $859 | $12,780 | $2,030 | $10,750 |
| 2019 | $752 | $12,780 | $2,030 | $10,750 |
| 2018 | $757 | $12,780 | $2,030 | $10,750 |
| 2017 | $881 | $13,550 | $2,240 | $11,310 |
| 2016 | $848 | $12,990 | $2,240 | $10,750 |
| 2015 | $1,198 | $12,990 | $2,240 | $10,750 |
| 2014 | $1,092 | $15,650 | $2,700 | $12,950 |
| 2013 | $526 | $15,650 | $2,700 | $12,950 |
Source: Public Records
Map
Nearby Homes
- 806 Troy Place NW
- 811 Troy Place NW
- 905 High Ave NW
- 722 High Ave NW
- 824 12th St NW
- 916 6th St NW
- 1005 Dewalt Ave NW
- 1007 Dewalt Ave NW
- 1023 Fulton Rd NW
- 1221 9th St NW
- 1227 Worley Ave NW
- 1231 Worley Ave NW
- 1015 4th St NW
- 413 Newton Ave NW
- 1306 12th St NW
- 1224 Cleveland Ave NW
- 1024 3rd St NW
- 1405 8th St NW
- 1409 8th St NW
- 935 Ridge Rd NW
- 907 Shorb Ave NW
- 831 Shorb Ave NW
- 910 Herbert Place NW
- 915 9th St NW
- 912 Herbert Place NW
- 915 Shorb Ave NW
- 826 Clover Ct NW
- 829 Shorb Ave NW
- 900 Shorb Ave NW
- 914 9th St NW
- 910 Shorb Ave NW
- 832 Shorb Ave NW
- 906 Shorb Ave NW
- 921 Shorb Ave NW
- 925 9th St NW
- 920 9th St NW
- 828 Shorb Ave NW
- 819 Shorb Ave NW
- 918 Troy Place NW
- 915 Wilson Place NW