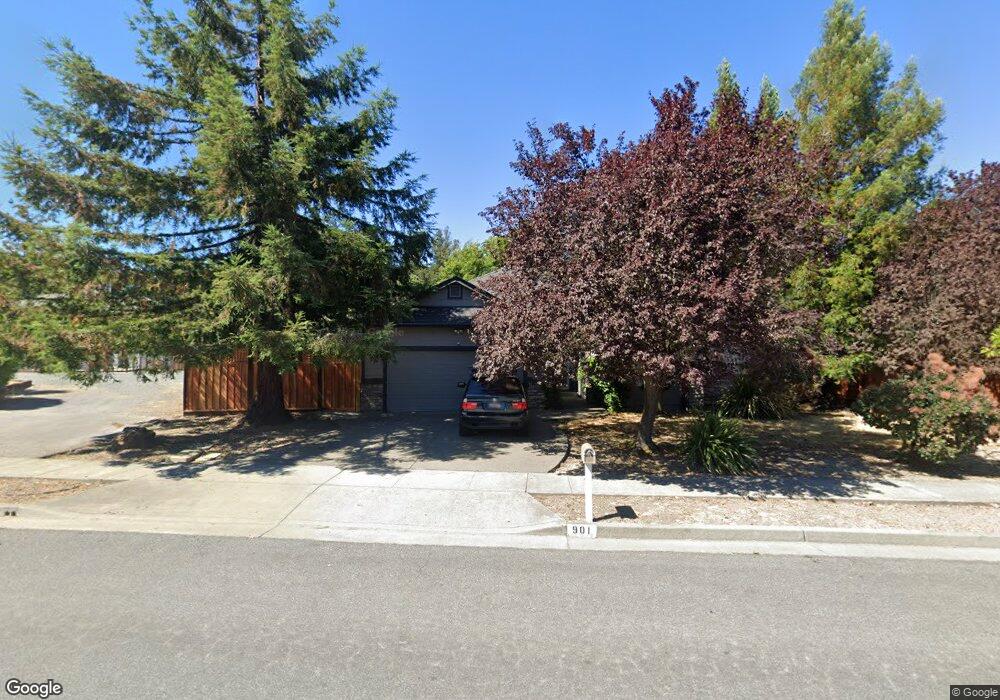
901 Sunnyslope Rd Petaluma, CA 94952
Western Petaluma NeighborhoodEstimated Value: $1,177,000 - $1,308,000
4
Beds
3
Baths
2,399
Sq Ft
$515/Sq Ft
Est. Value
About This Home
This home is located at 901 Sunnyslope Rd, Petaluma, CA 94952 and is currently estimated at $1,236,148, approximately $515 per square foot. 901 Sunnyslope Rd is a home located in Sonoma County with nearby schools including McNear Elementary School, Petaluma Junior High School, and Petaluma High School.
Ownership History
Date
Name
Owned For
Owner Type
Purchase Details
Closed on
Jul 13, 2006
Sold by
Kirk Blair and Kirk Julie
Bought by
Kirk Blair A and Kirk Julie A
Current Estimated Value
Purchase Details
Closed on
Aug 30, 2000
Sold by
Ken Roberts & Son General Contractor
Bought by
Kirk Blair and Kirk Julie
Home Financials for this Owner
Home Financials are based on the most recent Mortgage that was taken out on this home.
Original Mortgage
$466,000
Interest Rate
8.13%
Mortgage Type
Balloon
Purchase Details
Closed on
Jan 18, 2000
Sold by
Kotsaris Bradley N and Kotsaris Diane L
Bought by
Ken Roberts & Son General Contractor
Purchase Details
Closed on
Jul 29, 1996
Sold by
Tennyson Helen and Tennyson Paul
Bought by
Kotsaris Bradley N
Home Financials for this Owner
Home Financials are based on the most recent Mortgage that was taken out on this home.
Original Mortgage
$200,000
Interest Rate
8.33%
Mortgage Type
Balloon
Create a Home Valuation Report for This Property
The Home Valuation Report is an in-depth analysis detailing your home's value as well as a comparison with similar homes in the area
Home Values in the Area
Average Home Value in this Area
Purchase History
| Date | Buyer | Sale Price | Title Company |
|---|---|---|---|
| Kirk Blair A | -- | None Available | |
| Kirk Blair | $582,500 | Old Republic Title Company | |
| Ken Roberts & Son General Contractor | $140,000 | Old Republic Title Company | |
| Kotsaris Bradley N | $350,000 | Chicago Title Co |
Source: Public Records
Mortgage History
| Date | Status | Borrower | Loan Amount |
|---|---|---|---|
| Closed | Kirk Blair | $466,000 | |
| Previous Owner | Kotsaris Bradley N | $200,000 |
Source: Public Records
Tax History Compared to Growth
Tax History
| Year | Tax Paid | Tax Assessment Tax Assessment Total Assessment is a certain percentage of the fair market value that is determined by local assessors to be the total taxable value of land and additions on the property. | Land | Improvement |
|---|---|---|---|---|
| 2025 | $9,379 | $877,744 | $256,160 | $621,584 |
| 2024 | $9,379 | $860,535 | $251,138 | $609,397 |
| 2023 | $9,379 | $843,663 | $246,214 | $597,449 |
| 2022 | $9,101 | $827,122 | $241,387 | $585,735 |
| 2021 | $8,928 | $810,904 | $236,654 | $574,250 |
| 2020 | $9,004 | $802,590 | $234,228 | $568,362 |
| 2019 | $8,891 | $786,854 | $229,636 | $557,218 |
| 2018 | $8,856 | $771,427 | $225,134 | $546,293 |
| 2017 | $8,669 | $756,302 | $220,720 | $535,582 |
| 2016 | $8,466 | $741,474 | $216,393 | $525,081 |
| 2015 | $8,347 | $730,337 | $213,143 | $517,194 |
| 2014 | $8,305 | $716,031 | $208,968 | $507,063 |
Source: Public Records
Map
Nearby Homes
- 304 Parkview Ct
- 15 Kingswood Dr
- Residence 12 Plan at Aspect
- 22 Oak Knoll Ct
- 1170 I St
- 23 Pinnacle Dr
- 9 Arlene Ct
- 886 Olive St
- 853 D St
- 21 Branching Way
- 4 George Terrace
- 5 George Terrace
- 45 Augusta Cir
- 720 Petaluma Blvd S Unit 27
- 720 Petaluma Blvd S Unit 30
- 720 Petaluma Blvd S Unit 39
- 5 Troon Terrace
- 1028 Addison Cir
- 100 Orchard Ln
- 218 Jacquelyn Ln
- 3 Kotsaris Ct
- 7 Kotsaris Ct
- 821 Sunnyslope Rd
- 344 Ridgeview Dr
- 11 Kotsaris Ct
- 100 Vista View Place
- 349 Ridgeview Dr
- 340 Ridgeview Dr
- 819 Sunnyslope Rd
- 4 Kotsaris Ct
- 13 Kotsaris Ct
- 911 Sunnyslope Rd
- 8 Kotsaris Ct
- 104 Vista View Place
- 345 Ridgeview Dr
- 101 Vista View Place
- 336 Ridgeview Dr
- 352 Smith Dr
- 4 Jerome Ct
- 341 Ridgeview Dr