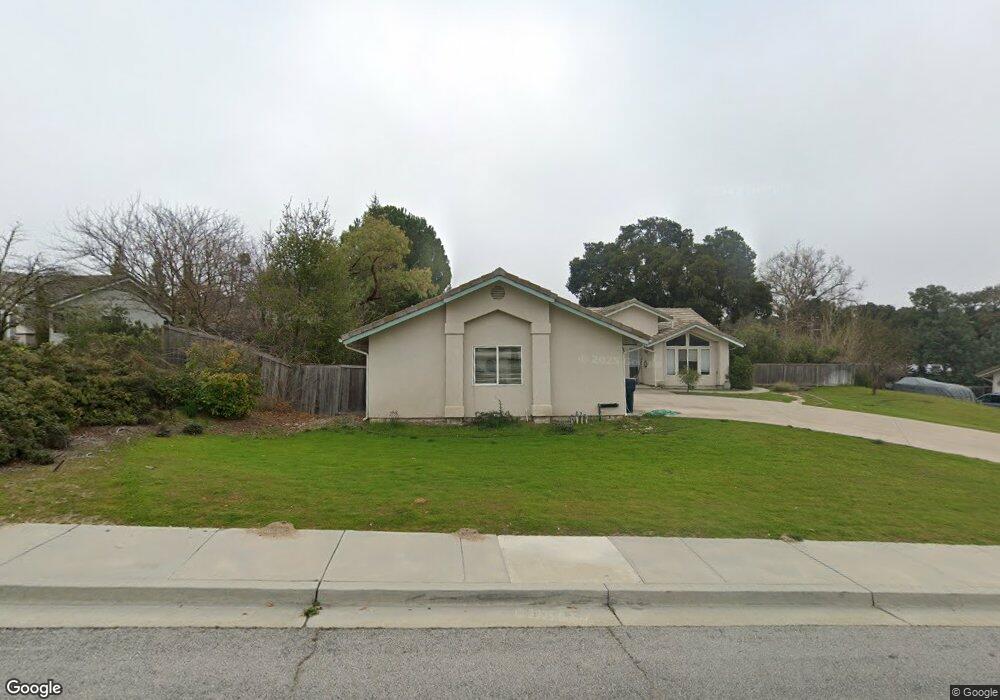
9010 Via Tortuga Atascadero, CA 93422
Estimated Value: $820,000 - $934,096
4
Beds
2
Baths
2,100
Sq Ft
$422/Sq Ft
Est. Value
About This Home
This home is located at 9010 Via Tortuga, Atascadero, CA 93422 and is currently estimated at $887,024, approximately $422 per square foot. 9010 Via Tortuga is a home located in San Luis Obispo County with nearby schools including Santa Rosa Road Academic Academy, Atascadero Middle School, and Atascadero High School.
Ownership History
Date
Name
Owned For
Owner Type
Purchase Details
Closed on
Feb 23, 2017
Sold by
Gallucci Frank J
Bought by
Gallucci Frank and 2017 Frank Gallucci Revocable
Current Estimated Value
Purchase Details
Closed on
Oct 11, 2000
Sold by
Deline Gregory and Deline Marcia
Bought by
Gallucci Frank J
Home Financials for this Owner
Home Financials are based on the most recent Mortgage that was taken out on this home.
Original Mortgage
$119,000
Interest Rate
7.66%
Purchase Details
Closed on
Mar 12, 1998
Sold by
Charnley Andrew
Bought by
Deline Gregory and Deline Marcia
Home Financials for this Owner
Home Financials are based on the most recent Mortgage that was taken out on this home.
Original Mortgage
$195,500
Interest Rate
6.88%
Purchase Details
Closed on
Dec 15, 1997
Sold by
Clark Iverson Ernest and Iverson Living Trust
Bought by
Andrew Charnley
Home Financials for this Owner
Home Financials are based on the most recent Mortgage that was taken out on this home.
Original Mortgage
$170,000
Interest Rate
7.22%
Create a Home Valuation Report for This Property
The Home Valuation Report is an in-depth analysis detailing your home's value as well as a comparison with similar homes in the area
Home Values in the Area
Average Home Value in this Area
Purchase History
| Date | Buyer | Sale Price | Title Company |
|---|---|---|---|
| Gallucci Frank | -- | None Available | |
| Gallucci Frank J | $345,000 | Fidelity National Title Co | |
| Deline Gregory | $250,000 | Cuesta Title | |
| Andrew Charnley | $77,500 | Chicago Title Co |
Source: Public Records
Mortgage History
| Date | Status | Borrower | Loan Amount |
|---|---|---|---|
| Previous Owner | Gallucci Frank J | $119,000 | |
| Previous Owner | Deline Gregory | $195,500 | |
| Previous Owner | Andrew Charnley | $170,000 |
Source: Public Records
Tax History Compared to Growth
Tax History
| Year | Tax Paid | Tax Assessment Tax Assessment Total Assessment is a certain percentage of the fair market value that is determined by local assessors to be the total taxable value of land and additions on the property. | Land | Improvement |
|---|---|---|---|---|
| 2025 | $6,165 | $519,838 | $180,809 | $339,029 |
| 2024 | $6,161 | $509,646 | $177,264 | $332,382 |
| 2023 | $6,161 | $499,654 | $173,789 | $325,865 |
| 2022 | $5,998 | $489,858 | $170,382 | $319,476 |
| 2021 | $5,811 | $480,254 | $167,042 | $313,212 |
| 2020 | $5,690 | $475,331 | $165,330 | $310,001 |
| 2019 | $5,524 | $466,012 | $162,089 | $303,923 |
| 2018 | $5,379 | $456,875 | $158,911 | $297,964 |
| 2017 | $5,276 | $447,918 | $155,796 | $292,122 |
| 2016 | $5,176 | $439,137 | $152,742 | $286,395 |
| 2015 | $5,100 | $432,542 | $150,448 | $282,094 |
| 2014 | $4,678 | $424,070 | $147,501 | $276,569 |
Source: Public Records
Map
Nearby Homes
- 8070 Coromar Ave
- 8850 El Camino Real Unit 9
- 8740 El Camino Real Unit A
- 8120 Azucena Ave
- 8375 Amapoa Ave
- 8395 Amapoa Ave
- 8393 Amapoa Ave
- 0 Cascada Unit NS25147099
- 8670 Santa Rosa Rd
- 7605 Morro Rd
- 8892 Palomar Ave
- 7906 Curbaril Ave
- 8920 Arcade Rd
- 9415 Casa Bella Ct
- 7300 Morro Rd
- 7250 Morro Rd
- 8510 Paseo de Caballo
- 7100 Morro Rd
- 9240 Carmelita Ave
- 8955 Curbaril Ave
- 9020 Via Tortuga
- 9000 Via Tortuga
- 8705 Atascadero Ave
- 8753 Atascadero Ave
- 9015 Via Tortuga
- 9030 Via Tortuga
- 9955 Calle Refugio
- 9025 Via Tortuga
- 9005 Via Tortuga
- 8775 Atascadero Ave
- 8785 Atascadero Ave
- 8720 Atascadero Ave
- 9035 Via Tortuga
- 9040 Via Tortuga
- 8680 Atascadero Ave
- 8760 Atascadero Ave
- 8809 Atascadero Ave
- 8565 Atascadero Ave
- 9045 Via Tortuga
- 8650 Atascadero Ave