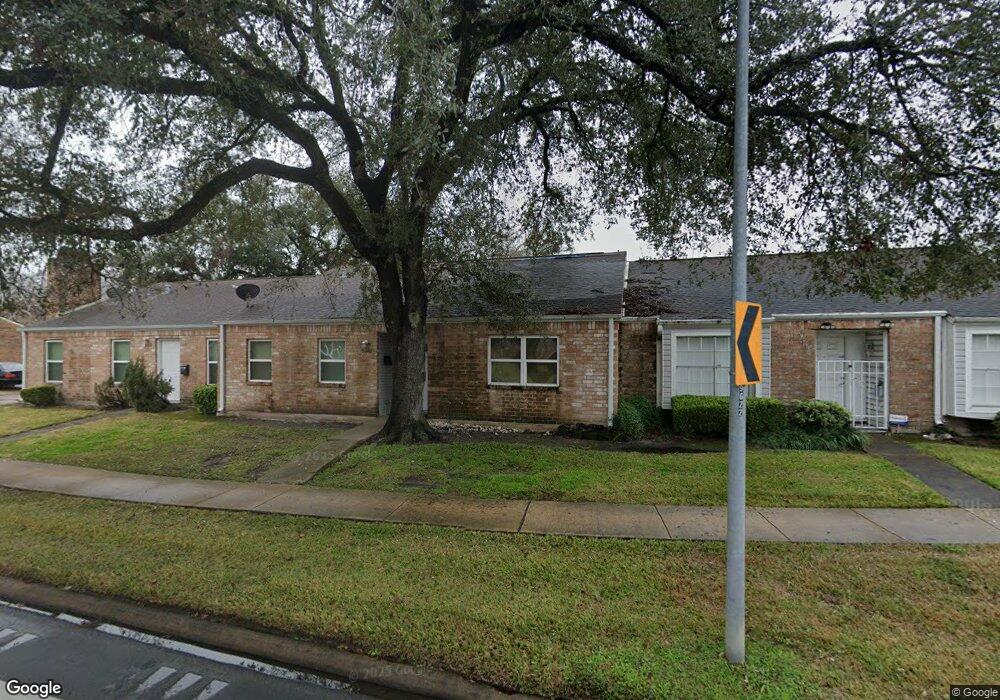
9010 Wilcrest Dr Unit 9010 Houston, TX 77099
Alief NeighborhoodEstimated Value: $167,000 - $211,000
3
Beds
2
Baths
1,517
Sq Ft
$119/Sq Ft
Est. Value
About This Home
This home is located at 9010 Wilcrest Dr Unit 9010, Houston, TX 77099 and is currently estimated at $181,082, approximately $119 per square foot. 9010 Wilcrest Dr Unit 9010 is a home located in Harris County with nearby schools including Boone Elementary School, Klentzman Intermediate School, and Olle Middle School.
Ownership History
Date
Name
Owned For
Owner Type
Purchase Details
Closed on
Jun 22, 2017
Sold by
Ly Thanh X
Bought by
Martinez David Villanueva and Villanueva Martinez Rosa Invette
Current Estimated Value
Home Financials for this Owner
Home Financials are based on the most recent Mortgage that was taken out on this home.
Original Mortgage
$78,400
Outstanding Balance
$41,179
Interest Rate
4.05%
Mortgage Type
New Conventional
Estimated Equity
$139,903
Purchase Details
Closed on
Sep 29, 2014
Sold by
Robinson Leighton A and Robinson Victoria E
Bought by
Ly Thanh X
Purchase Details
Closed on
Jun 26, 1997
Sold by
Laris Betty W
Bought by
Robinson Leighton A and Robinson Victoria E
Home Financials for this Owner
Home Financials are based on the most recent Mortgage that was taken out on this home.
Original Mortgage
$33,250
Interest Rate
7.92%
Mortgage Type
Purchase Money Mortgage
Create a Home Valuation Report for This Property
The Home Valuation Report is an in-depth analysis detailing your home's value as well as a comparison with similar homes in the area
Home Values in the Area
Average Home Value in this Area
Purchase History
| Date | Buyer | Sale Price | Title Company |
|---|---|---|---|
| Martinez David Villanueva | -- | First American Title | |
| Ly Thanh X | -- | None Available | |
| Robinson Leighton A | -- | Fidelity National Title |
Source: Public Records
Mortgage History
| Date | Status | Borrower | Loan Amount |
|---|---|---|---|
| Open | Martinez David Villanueva | $78,400 | |
| Previous Owner | Robinson Leighton A | $33,250 |
Source: Public Records
Tax History Compared to Growth
Tax History
| Year | Tax Paid | Tax Assessment Tax Assessment Total Assessment is a certain percentage of the fair market value that is determined by local assessors to be the total taxable value of land and additions on the property. | Land | Improvement |
|---|---|---|---|---|
| 2025 | $4,074 | $179,354 | $24,000 | $155,354 |
| 2024 | $4,074 | $179,354 | $24,000 | $155,354 |
| 2023 | $4,074 | $179,354 | $24,000 | $155,354 |
| 2022 | $3,674 | $151,444 | $24,000 | $127,444 |
| 2021 | $2,833 | $116,071 | $12,800 | $103,271 |
| 2020 | $2,652 | $104,862 | $12,800 | $92,062 |
| 2019 | $2,694 | $97,830 | $12,800 | $85,030 |
| 2018 | $883 | $66,425 | $12,800 | $53,625 |
| 2017 | $1,811 | $66,425 | $12,800 | $53,625 |
| 2016 | $1,560 | $57,205 | $12,800 | $44,405 |
| 2015 | $1,042 | $66,522 | $12,800 | $53,722 |
| 2014 | $1,042 | $56,810 | $12,800 | $44,010 |
Source: Public Records
Map
Nearby Homes
- 8710 Wilcrest Dr Unit 8710
- 9146 Wilcrest Dr Unit 9146
- 10662 Bexley Dr
- 8563 Wilcrest Dr
- 8587 Wilcrest Dr
- 8589 Wilcrest Dr
- 11214 Riderwood Dr
- 8405 Wilcrest Dr Unit 3010
- 8405 Wilcrest Dr Unit 2412
- 8405 Wilcrest Dr Unit 2206
- 8405 Wilcrest Dr Unit 1606
- 8405 Wilcrest Dr Unit 2010
- 8405 Wilcrest Dr Unit 2205
- 8323 Wilcrest Dr Unit 12010
- 8323 Wilcrest Dr Unit 8006
- 11406 Herald Square Dr
- 11106 Lewis Dr
- 11427 Newbrook Dr
- 10525 Bissonnet St
- 9797 Leawood Blvd Unit 303
- 9008 Wilcrest Dr Unit 9008
- 9012 Wilcrest Dr Unit 9012
- 9018 Wilcrest Dr Unit 9018
- 9020 Wilcrest Dr Unit 9020
- 9004 Wilcrest Dr Unit 9004
- 9022 Wilcrest Dr Unit 9022
- 9080 Wilcrest Dr Unit 9080
- 8976 Wilcrest Dr Unit 8976
- 10924 Glenwolde Dr Unit 924
- 9002 Wilcrest Dr Unit 9002
- 9024 Wilcrest Dr Unit 9024
- 8974 Wilcrest Dr Unit 8974
- 9068 Wilcrest Dr Unit 9068
- 9026 Wilcrest Dr Unit 9026
- 9082 Wilcrest Dr Unit 9082
- 9066 Wilcrest Dr Unit 9066
- 9064 Wilcrest Dr Unit 9064
- 10830 Herald Square Dr
- 8972 Wilcrest Dr Unit 8972
- 9062 Wilcrest Dr Unit 9062