K
Seller's Agent in 2025
Kay Dowd
Keller Williams South Park
(704) 777-4400
58 Total Sales
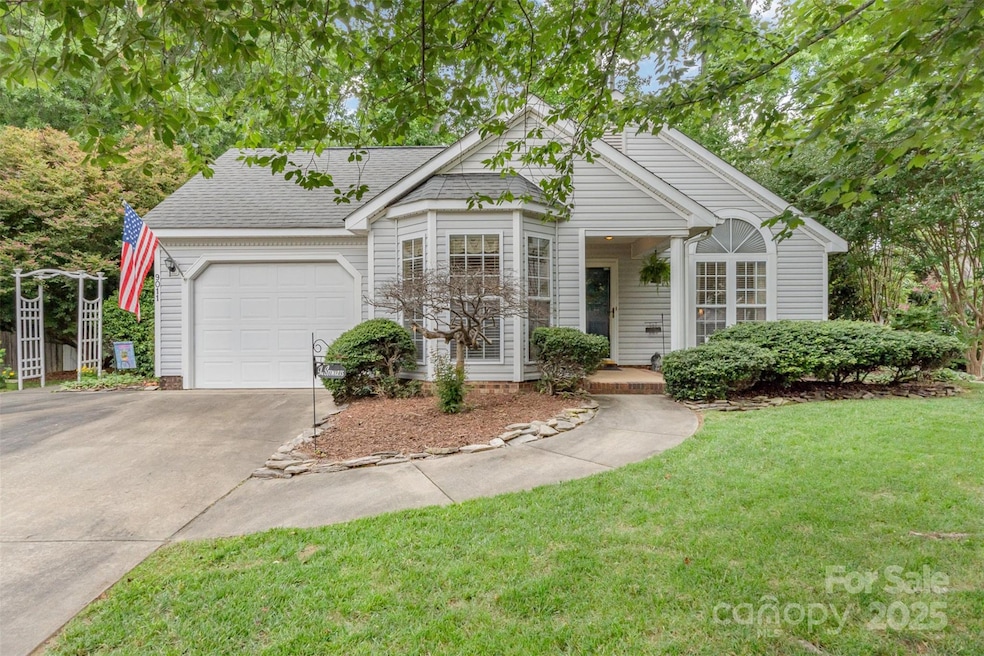


Welcome to this delightful move-in ready ranch in desirable Matthews, NC; featuring a 1-car attached garage, a spacious all-season porch (heated and cooled), a greenhouse, and a storage shed. The home offers excellent curb appeal and a beautifully landscaped backyard oasis, perfect for relaxing in the shade during the warmer months.
Inside, enjoy the comfort of a newer HVAC system (2023) and a smart thermostat for modern efficiency. The primary suite is a standout, featuring a walk-in closet, freestanding soaking tub, and a separate walk-in shower.
Located in a community with a refreshing summer pool and low HOA dues, you’re just minutes from shops, restaurants, and scenic greenways.
Last Agent to Sell the Property
Keller Williams South Park Brokerage Email: kdowd@redbudclt.com License #345451 Listed on: 06/19/2025

Co-Listed By
Keller Williams South Park Brokerage Email: kdowd@redbudclt.com License #266315
| Date | Type | Sale Price | Title Company |
|---|---|---|---|
| Warranty Deed | $375,000 | Chicago Title | |
| Warranty Deed | $119,000 | None Available | |
| Interfamily Deed Transfer | -- | -- | |
| Warranty Deed | $120,000 | -- |
| Date | Status | Loan Amount | Loan Type |
|---|---|---|---|
| Open | $290,000 | New Conventional | |
| Previous Owner | $95,200 | New Conventional | |
| Previous Owner | $112,475 | FHA |
| Date | Event | Price | List to Sale | Price per Sq Ft |
|---|---|---|---|---|
| 08/13/2025 08/13/25 | Sold | $375,000 | -2.6% | $245 / Sq Ft |
| 06/26/2025 06/26/25 | Pending | -- | -- | -- |
| 06/19/2025 06/19/25 | For Sale | $385,000 | -- | $252 / Sq Ft |
| Year | Tax Paid | Tax Assessment Tax Assessment Total Assessment is a certain percentage of the fair market value that is determined by local assessors to be the total taxable value of land and additions on the property. | Land | Improvement |
|---|---|---|---|---|
| 2025 | $2,635 | $383,600 | $0 | $0 |
| 2024 | $2,077 | $234,400 | $49,500 | $184,900 |
| 2023 | $1,993 | $234,400 | $49,500 | $184,900 |
| 2022 | $1,972 | $234,400 | $49,500 | $184,900 |
| 2021 | $1,971 | $234,400 | $49,500 | $184,900 |
| 2020 | $1,664 | $162,400 | $28,500 | $133,900 |
| 2019 | $1,664 | $162,400 | $28,500 | $133,900 |
| 2018 | $1,664 | $162,400 | $28,500 | $133,900 |
| 2017 | $1,745 | $162,400 | $28,500 | $133,900 |
| 2016 | $1,722 | $162,400 | $28,500 | $133,900 |
| 2015 | $1,739 | $162,400 | $28,500 | $133,900 |
| 2014 | $1,037 | $146,460 | $27,000 | $119,460 |
K
Seller's Agent in 2025
Kay Dowd
Keller Williams South Park
(704) 777-4400
58 Total Sales
Seller Co-Listing Agent in 2025
Trent Corbin
Keller Williams South Park
(704) 459-1238
994 Total Sales
Buyer's Agent in 2025
Andrew Rosen
COMPASS
(704) 604-4756
120 Total Sales
Source: Canopy MLS (Canopy Realtor® Association)
MLS Number: 4270972
APN: 07-129-728
Disclaimer: Certain information contained herein is derived from information provided by parties other than Homes.com. All information provided is deemed reliable, but is not guaranteed to be accurate and should be independently verified.
![]() All data is obtained from various sources and may not have been verified by broker or MLS GRID. Supplied Open House Information is subject to change without notice. All information should be independently reviewed and verified for accuracy. Properties may or may not be listed by the office/agent presenting the information. Some IDX listings have been excluded from this website.
All data is obtained from various sources and may not have been verified by broker or MLS GRID. Supplied Open House Information is subject to change without notice. All information should be independently reviewed and verified for accuracy. Properties may or may not be listed by the office/agent presenting the information. Some IDX listings have been excluded from this website.
Based on information submitted to the MLS GRID
Ask me questions while you tour the home.