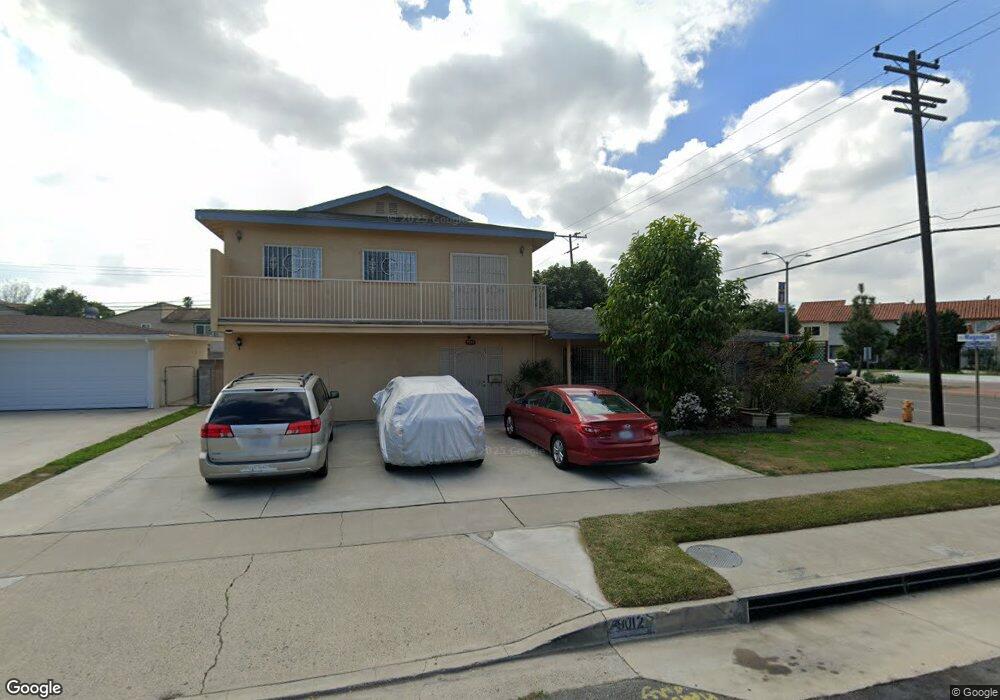
9012 Ingram Ave Garden Grove, CA 92844
Estimated Value: $957,000 - $1,398,668
3
Beds
2
Baths
3,116
Sq Ft
$367/Sq Ft
Est. Value
About This Home
This home is located at 9012 Ingram Ave, Garden Grove, CA 92844 and is currently estimated at $1,143,667, approximately $367 per square foot. 9012 Ingram Ave is a home located in Orange County with nearby schools including Cook Elementary School, Donald S. Jordan Intermediate School, and Bolsa Grande High School.
Ownership History
Date
Name
Owned For
Owner Type
Purchase Details
Closed on
Feb 19, 2023
Sold by
Tran Richard Quang-Anh
Bought by
Family Living Trust
Current Estimated Value
Purchase Details
Closed on
Aug 17, 2018
Sold by
Tran Richard
Bought by
Quang Anh Tran Richard and The Richard Quang Anh Tran Living Trust
Purchase Details
Closed on
Aug 9, 2012
Sold by
Nguyen Peter
Bought by
Tran Richard
Purchase Details
Closed on
Oct 18, 2011
Sold by
Pham Kathy Tu
Bought by
Nguyen Peter and Tran Richard
Purchase Details
Closed on
Nov 26, 2010
Sold by
Western Light Llc
Bought by
Pham Kathy T
Purchase Details
Closed on
Apr 28, 2010
Sold by
Tran Quanganh
Bought by
Western Light Llc
Purchase Details
Closed on
Mar 10, 2010
Sold by
The Kathy T Pham Trust
Bought by
Tran Quanganh
Purchase Details
Closed on
Nov 17, 2009
Sold by
Pham Kathy T
Bought by
Kathy T Pham Trust
Create a Home Valuation Report for This Property
The Home Valuation Report is an in-depth analysis detailing your home's value as well as a comparison with similar homes in the area
Home Values in the Area
Average Home Value in this Area
Purchase History
| Date | Buyer | Sale Price | Title Company |
|---|---|---|---|
| Family Living Trust | -- | -- | |
| Tran Richard Quang-Anh | -- | -- | |
| Quang Anh Tran Richard | -- | None Available | |
| Tran Richard | -- | None Available | |
| Nguyen Peter | $339,000 | Lawyers Title | |
| Pham Kathy T | -- | None Available | |
| Western Light Llc | $285,000 | None Available | |
| Tran Quanganh | $295,000 | None Available | |
| Kathy T Pham Trust | -- | None Available |
Source: Public Records
Tax History Compared to Growth
Tax History
| Year | Tax Paid | Tax Assessment Tax Assessment Total Assessment is a certain percentage of the fair market value that is determined by local assessors to be the total taxable value of land and additions on the property. | Land | Improvement |
|---|---|---|---|---|
| 2025 | $6,230 | $502,418 | $294,853 | $207,565 |
| 2024 | $6,230 | $492,567 | $289,071 | $203,496 |
| 2023 | $6,033 | $482,909 | $283,403 | $199,506 |
| 2022 | $5,904 | $473,441 | $277,846 | $195,595 |
| 2021 | $5,840 | $464,158 | $272,398 | $191,760 |
| 2020 | $5,762 | $459,399 | $269,605 | $189,794 |
| 2019 | $5,650 | $450,392 | $264,319 | $186,073 |
| 2018 | $5,618 | $441,561 | $259,136 | $182,425 |
| 2017 | $5,542 | $432,903 | $254,054 | $178,849 |
| 2016 | $5,267 | $424,415 | $249,072 | $175,343 |
| 2015 | $5,194 | $418,040 | $245,330 | $172,710 |
| 2014 | $5,069 | $409,852 | $240,525 | $169,327 |
Source: Public Records
Map
Nearby Homes
- 13839 Magnolia St
- 9200 Westminster Blvd Unit 25
- 8784 Hewitt Place Unit 12
- 8866 Grandville Cir
- 13411 Magnolia St
- 13392 Magnolia St
- 8741 Jennrich Ave
- 13782 Newland St
- 8902 Mcclure Ave
- 14431 Nola St
- 8442 Trask Ave
- 13252 Newland St Unit A-D
- 14642 Birch St
- 14572 Purdy St
- 14362 Bushard St Unit 39
- 14362 Bushard St Unit 38
- 14362 Bushard St Unit 109
- 8202 19th St
- 13175 Creek View Dr Unit F
- 8196 18th St
- 9022 Ingram Ave
- 13912 Magnolia St
- 13910 Magnolia St
- 13914 Magnolia St
- 13916 Magnolia St
- 13918 Magnolia St
- 9042 Ingram Ave
- 13920 Magnolia St
- 13862 Magnolia St
- 13903 Magnolia St
- 13922 Magnolia St
- 13893 Magnolia St
- 13899 Magnolia St
- 13897 Magnolia St
- 13915 Magnolia St
- 13891 Magnolia St
- 13911 Magnolia St
- 13909 Magnolia St
- 13917 Magnolia St
- 9052 Ingram Ave