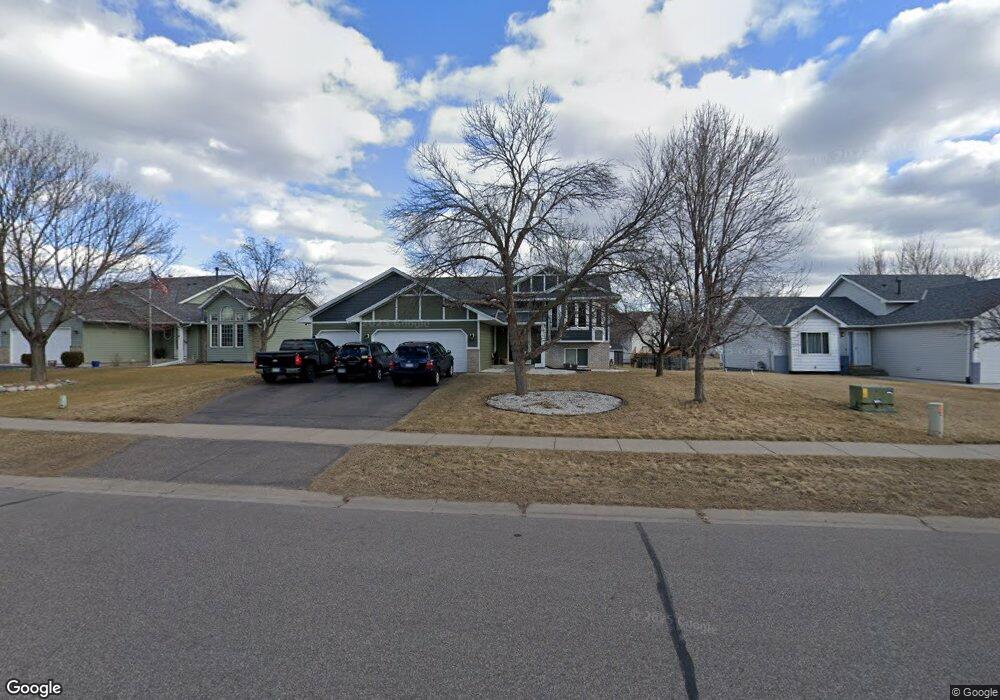
9012 Regent Pkwy Brooklyn Park, MN 55443
Trinity Gardens NeighborhoodEstimated Value: $373,000 - $436,000
5
Beds
2
Baths
1,216
Sq Ft
$332/Sq Ft
Est. Value
About This Home
This home is located at 9012 Regent Pkwy, Brooklyn Park, MN 55443 and is currently estimated at $403,445, approximately $331 per square foot. 9012 Regent Pkwy is a home located in Hennepin County with nearby schools including Edinbrook Elementary School, North View Middle School, and Park Center Senior High.
Ownership History
Date
Name
Owned For
Owner Type
Purchase Details
Closed on
Oct 5, 2020
Sold by
Vue Andrew
Bought by
Chang Seng and Chang Yia
Current Estimated Value
Home Financials for this Owner
Home Financials are based on the most recent Mortgage that was taken out on this home.
Original Mortgage
$267,700
Outstanding Balance
$238,105
Interest Rate
2.9%
Mortgage Type
New Conventional
Estimated Equity
$165,340
Purchase Details
Closed on
Jan 26, 2018
Sold by
Sprout Erin and Sprout David
Bought by
Vue Andrew
Home Financials for this Owner
Home Financials are based on the most recent Mortgage that was taken out on this home.
Original Mortgage
$279,748
Interest Rate
3.93%
Mortgage Type
New Conventional
Purchase Details
Closed on
Jul 9, 2008
Sold by
Bank Of New York
Bought by
Sprout David and Sprout Erin
Purchase Details
Closed on
Sep 15, 2006
Sold by
Cutter Brown Nicole R and Brown Paul
Bought by
Conteh Finnah M
Purchase Details
Closed on
Mar 28, 2006
Sold by
Ayers Linda S
Bought by
Brown Cutter Nicole R and Bauermeister Duane
Create a Home Valuation Report for This Property
The Home Valuation Report is an in-depth analysis detailing your home's value as well as a comparison with similar homes in the area
Home Values in the Area
Average Home Value in this Area
Purchase History
| Date | Buyer | Sale Price | Title Company |
|---|---|---|---|
| Chang Seng | $276,000 | Land Title Inc | |
| Vue Andrew | $288,400 | Liberty Title Inc | |
| Sprout David | $191,900 | -- | |
| Conteh Finnah M | $269,900 | -- | |
| Brown Cutter Nicole R | $165,000 | -- | |
| Chang Seng Seng | $276,000 | -- |
Source: Public Records
Mortgage History
| Date | Status | Borrower | Loan Amount |
|---|---|---|---|
| Open | Chang Seng | $267,700 | |
| Previous Owner | Vue Andrew | $279,748 | |
| Closed | Chang Seng Seng | $267,700 |
Source: Public Records
Tax History Compared to Growth
Tax History
| Year | Tax Paid | Tax Assessment Tax Assessment Total Assessment is a certain percentage of the fair market value that is determined by local assessors to be the total taxable value of land and additions on the property. | Land | Improvement |
|---|---|---|---|---|
| 2024 | $5,377 | $372,200 | $120,000 | $252,200 |
| 2023 | $5,268 | $382,200 | $120,000 | $262,200 |
| 2022 | $4,330 | $363,600 | $120,000 | $243,600 |
| 2021 | $4,298 | $311,900 | $68,000 | $243,900 |
| 2020 | $5,197 | $310,500 | $68,000 | $242,500 |
| 2019 | $4,082 | $297,700 | $68,000 | $229,700 |
| 2018 | $3,636 | $257,400 | $60,200 | $197,200 |
| 2017 | $3,587 | $230,200 | $60,200 | $170,000 |
| 2016 | $3,312 | $211,900 | $60,200 | $151,700 |
| 2015 | $3,139 | $197,400 | $50,200 | $147,200 |
| 2014 | -- | $185,500 | $50,200 | $135,300 |
Source: Public Records
Map
Nearby Homes
- 5333 89th Crescent Cir N
- 9200 Woodhall Bay N
- 5203 Kings Crossing
- 9217 Trinity Gardens
- 5110 92nd Crescent
- 4824 89th Crescent N
- 5126 94th Ln N
- 5208 94th Ln N
- 4624 89th Crescent N
- 4717 Oxborough Gardens
- 9101 Nantwick Ridge
- 5321 94th Ln N
- 8724 Loch Lomond Blvd
- 9036 Moorland Chase
- 9121 Loch Lomond Blvd
- 5125 95th Way N
- 8700 Kilbirnie Terrace
- 8442 Toledo Ave N
- 8439 Toledo Ave N
- 9513 Scott Ln N
- 9006 Regent Pkwy
- 9018 Regent Pkwy
- 5410 89th Crescent Cir N
- 9000 Regent Pkwy
- 9024 Regent Pkwy
- 5418 89th Crescent Cir N
- 9013 Regent Pkwy
- 9007 Regent Pkwy
- 8980 Regent Pkwy
- 9019 Regent Pkwy
- 5402 89th Crescent Cir N
- 9025 Regent Pkwy
- 9001 Regent Pkwy
- 9031 Regent Pkwy
- 9037 Trinity Gardens
- 9031 Trinity Gardens
- 8974 Regent Pkwy
- 8981 Regent Pkwy
- 9025 Trinity Gardens
- 5366 89th Crescent Cir N