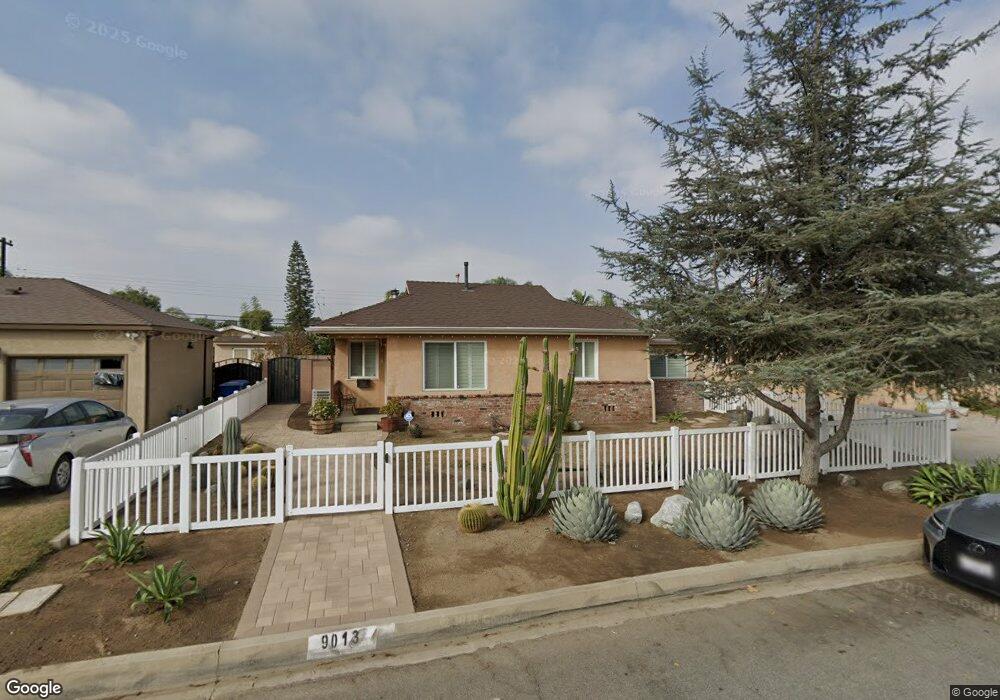
9013 Lemoran Ave Downey, CA 90240
Estimated Value: $774,605 - $828,000
3
Beds
1
Bath
1,456
Sq Ft
$549/Sq Ft
Est. Value
About This Home
This home is located at 9013 Lemoran Ave, Downey, CA 90240 and is currently estimated at $798,651, approximately $548 per square foot. 9013 Lemoran Ave is a home located in Los Angeles County with nearby schools including Unsworth Elementary School, Doty Middle School, and Downey High School.
Ownership History
Date
Name
Owned For
Owner Type
Purchase Details
Closed on
Aug 11, 2017
Sold by
Burgess Gregory
Bought by
Burgess Donna J
Current Estimated Value
Home Financials for this Owner
Home Financials are based on the most recent Mortgage that was taken out on this home.
Original Mortgage
$300,000
Outstanding Balance
$250,798
Interest Rate
4.03%
Mortgage Type
New Conventional
Estimated Equity
$547,853
Purchase Details
Closed on
Aug 5, 2017
Sold by
Takesky Joseph A and Blanche V Takesky Revocable Li
Bought by
Takesky Joseph A and Sjaarda Deborah A
Home Financials for this Owner
Home Financials are based on the most recent Mortgage that was taken out on this home.
Original Mortgage
$300,000
Outstanding Balance
$250,798
Interest Rate
4.03%
Mortgage Type
New Conventional
Estimated Equity
$547,853
Purchase Details
Closed on
Jan 30, 1997
Sold by
Takesky Blanche V
Bought by
Takesky Blanche V and Blanche V Takesky Revocable Tr
Purchase Details
Closed on
Sep 9, 1993
Sold by
Benitez Gener and Benitez Concepcion
Bought by
Takesky Robert and Takesky Blanche V
Create a Home Valuation Report for This Property
The Home Valuation Report is an in-depth analysis detailing your home's value as well as a comparison with similar homes in the area
Purchase History
| Date | Buyer | Sale Price | Title Company |
|---|---|---|---|
| Burgess Donna J | -- | Old Republic Title Company | |
| Takesky Joseph A | -- | Old Republic Title Company | |
| Takesky Blanche V | -- | -- | |
| Takesky Robert | -- | -- |
Source: Public Records
Mortgage History
| Date | Status | Borrower | Loan Amount |
|---|---|---|---|
| Open | Burgess Donna J | $300,000 |
Source: Public Records
Tax History
| Year | Tax Paid | Tax Assessment Tax Assessment Total Assessment is a certain percentage of the fair market value that is determined by local assessors to be the total taxable value of land and additions on the property. | Land | Improvement |
|---|---|---|---|---|
| 2025 | $2,142 | $143,792 | $29,143 | $114,649 |
| 2024 | $2,142 | $140,973 | $28,572 | $112,401 |
| 2023 | $2,079 | $138,210 | $28,012 | $110,198 |
| 2022 | $1,987 | $135,501 | $27,463 | $108,038 |
| 2021 | $1,924 | $132,845 | $26,925 | $105,920 |
| 2019 | $1,876 | $128,906 | $26,127 | $102,779 |
| 2018 | $1,728 | $126,379 | $25,615 | $100,764 |
| 2016 | $1,657 | $121,473 | $24,621 | $96,852 |
| 2015 | $1,632 | $119,650 | $24,252 | $95,398 |
| 2014 | $1,557 | $117,307 | $23,777 | $93,530 |
Source: Public Records
Map
Nearby Homes
- 9246 Claymore St
- 8901 Serapis Ave Unit 24
- 8611 Eglise Ave
- 8551 Eglise Ave
- 8447 Serapis Ave
- 9069 Gallatin Rd
- 8328 Buhman Ave
- 9145 Raviller Dr
- 8604 Whittle Ct
- 9440 Gallatin Rd
- 8530 Gallatin Rd Unit L
- 8806 Stamps Rd
- 8320 Orange Ave
- 9633 La Docena Ln
- 9123 Lubec St
- 9246 Manzanar Ave
- 8104 Arrington Ave
- 9434 Pico Vista Rd
- 9570 Gallatin Rd
- 7354 Diamond Dr
- 9007 Lemoran Ave
- 9019 Lemoran Ave
- 9003 Lemoran Ave
- 9022 Chaney Ave
- 9025 Lemoran Ave
- 9016 Chaney Ave
- 9028 Chaney Ave
- 9010 Chaney Ave
- 9034 Chaney Ave
- 9012 Lemoran Ave
- 9018 Lemoran Ave
- 9031 Lemoran Ave
- 9004 Chaney Ave
- 9004 Lemoran Ave
- 9040 Chaney Ave
- 9024 Lemoran Ave
- 9028 Lemoran Ave
- 9037 Lemoran Ave
- 9046 Chaney Ave
- 9295 Cedartree Rd
Your Personal Tour Guide
Ask me questions while you tour the home.