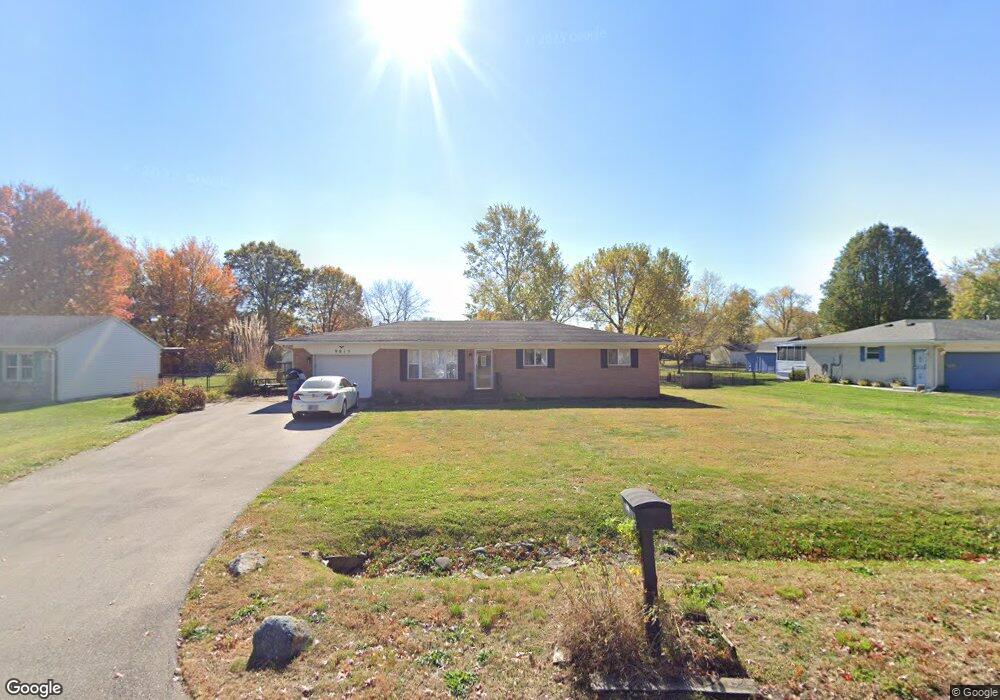
9015 Walton St Indianapolis, IN 46231
Chapel Hill-Ben Davis NeighborhoodEstimated Value: $220,817 - $256,000
3
Beds
2
Baths
1,419
Sq Ft
$163/Sq Ft
Est. Value
About This Home
This home is located at 9015 Walton St, Indianapolis, IN 46231 and is currently estimated at $231,704, approximately $163 per square foot. 9015 Walton St is a home located in Marion County with nearby schools including Chapel Glen Elementary School, Chapel Hill 7th & 8th Grade Center, and Ben Davis High School.
Ownership History
Date
Name
Owned For
Owner Type
Purchase Details
Closed on
Mar 27, 2020
Sold by
Quear Jason R
Bought by
Brackin Adam G
Current Estimated Value
Home Financials for this Owner
Home Financials are based on the most recent Mortgage that was taken out on this home.
Original Mortgage
$137,464
Outstanding Balance
$122,568
Interest Rate
3.75%
Mortgage Type
FHA
Estimated Equity
$109,136
Purchase Details
Closed on
May 25, 2012
Sold by
Arvin Thomas and Lentz Knute
Bought by
Quear Jason R
Home Financials for this Owner
Home Financials are based on the most recent Mortgage that was taken out on this home.
Original Mortgage
$102,999
Interest Rate
3.75%
Mortgage Type
FHA
Purchase Details
Closed on
Oct 13, 2009
Sold by
Sigmund Albert and Estate Of Iris Laverne Dodson
Bought by
Arvin Thomas and Lentz Knute
Create a Home Valuation Report for This Property
The Home Valuation Report is an in-depth analysis detailing your home's value as well as a comparison with similar homes in the area
Home Values in the Area
Average Home Value in this Area
Purchase History
| Date | Buyer | Sale Price | Title Company |
|---|---|---|---|
| Brackin Adam G | $140,000 | Chicago Title Company, Llc | |
| Quear Jason R | -- | None Available | |
| Arvin Thomas | -- | None Available |
Source: Public Records
Mortgage History
| Date | Status | Borrower | Loan Amount |
|---|---|---|---|
| Open | Brackin Adam G | $137,464 | |
| Previous Owner | Quear Jason R | $102,999 |
Source: Public Records
Tax History Compared to Growth
Tax History
| Year | Tax Paid | Tax Assessment Tax Assessment Total Assessment is a certain percentage of the fair market value that is determined by local assessors to be the total taxable value of land and additions on the property. | Land | Improvement |
|---|---|---|---|---|
| 2024 | $1,418 | $115,000 | $14,400 | $100,600 |
| 2023 | $1,418 | $115,000 | $14,400 | $100,600 |
| 2022 | $1,423 | $115,000 | $14,400 | $100,600 |
| 2021 | $1,435 | $105,500 | $14,400 | $91,100 |
| 2020 | $1,432 | $105,500 | $14,400 | $91,100 |
| 2019 | $1,476 | $108,700 | $14,400 | $94,300 |
| 2018 | $1,248 | $101,400 | $14,400 | $87,000 |
| 2017 | $967 | $101,900 | $14,400 | $87,500 |
| 2016 | $992 | $102,600 | $14,400 | $88,200 |
| 2014 | $708 | $99,600 | $14,400 | $85,200 |
| 2013 | $837 | $99,600 | $14,400 | $85,200 |
Source: Public Records
Map
Nearby Homes
- 9011 Walton St
- 403 Bagley Ln
- 421 Bridgeport Rd
- 606 Bakeway Cir
- 8853 Stonewall Dr
- 263 N Raceway Rd
- 9122 Broken Arrow Rd
- 9138 Broken Arrow Rd
- 8605 Spring Valley Ln
- 8729 Chapel Glen Dr
- 390 Nottinghill Ct
- 1249 Tenor Place
- 1256 Tenor Place
- 8645 Warrington Dr
- 8840 Ellington Dr
- 810 Kendale Ct
- 8539 Chapel Pines Dr
- 1442 Bank Place
- 821 Chapel Pines Dr W
- 8409 Chapel Pines Dr
- 9015 Walton Ave
- 9025 Walton St
- 9001 Walton St
- 9035 Walton St
- 9016 Walton St
- 9012 Walton St
- 8947 Walton St
- 9002 Walton Ave
- 9036 Walton St
- 9045 Walton St
- 9004 Jackson St
- 9012 Jackson St
- 9020 Jackson St
- 8952 Jackson St
- 8948 Walton St
- 8937 Walton St
- 9028 Jackson St
- 9046 Walton St
- 8946 Jackson St
- 9107 Walton Ave