902 18th St Belle Plaine, IA 52208
Estimated Value: $107,000 - $122,000
2
Beds
1
Bath
1,374
Sq Ft
$82/Sq Ft
Est. Value
About This Home
This home is located at 902 18th St, Belle Plaine, IA 52208 and is currently estimated at $112,282, approximately $81 per square foot. 902 18th St is a home located in Benton County with nearby schools including Longfellow Elementary School and Belle Plaine Junior/Senior High School.
Ownership History
Date
Name
Owned For
Owner Type
Purchase Details
Closed on
Aug 20, 2024
Sold by
Green House Group Llc
Bought by
Mobley Timothy
Current Estimated Value
Purchase Details
Closed on
Oct 8, 2018
Sold by
Wealth Maximus Llc
Bought by
Green House Group Llc
Purchase Details
Closed on
Sep 1, 2018
Sold by
Goedken Florian H Est
Bought by
Florian H Goedken T
Purchase Details
Closed on
Dec 1, 2014
Sold by
The Bank Of New York Mellon
Bought by
Wealth Maximus Llc
Create a Home Valuation Report for This Property
The Home Valuation Report is an in-depth analysis detailing your home's value as well as a comparison with similar homes in the area
Home Values in the Area
Average Home Value in this Area
Purchase History
| Date | Buyer | Sale Price | Title Company |
|---|---|---|---|
| Mobley Timothy | $43,250 | None Listed On Document | |
| Green House Group Llc | $18,240 | -- | |
| Florian H Goedken T | -- | -- | |
| Wealth Maximus Llc | $18,365 | None Available |
Source: Public Records
Tax History Compared to Growth
Tax History
| Year | Tax Paid | Tax Assessment Tax Assessment Total Assessment is a certain percentage of the fair market value that is determined by local assessors to be the total taxable value of land and additions on the property. | Land | Improvement |
|---|---|---|---|---|
| 2025 | $1,316 | $68,600 | $12,200 | $56,400 |
| 2024 | $1,316 | $66,800 | $11,900 | $54,900 |
| 2023 | $1,204 | $66,800 | $11,900 | $54,900 |
| 2022 | $1,178 | $54,800 | $9,500 | $45,300 |
| 2021 | $1,178 | $54,800 | $9,500 | $45,300 |
| 2020 | $816 | $37,600 | $10,700 | $26,900 |
| 2019 | $910 | $37,600 | $10,700 | $26,900 |
| 2018 | $812 | $40,300 | $9,300 | $31,000 |
| 2017 | $1,295 | $40,300 | $9,300 | $31,000 |
| 2016 | $864 | $38,700 | $8,900 | $29,800 |
| 2015 | $864 | $38,700 | $8,900 | $29,800 |
| 2014 | $1,446 | $66,300 | $0 | $0 |
Source: Public Records
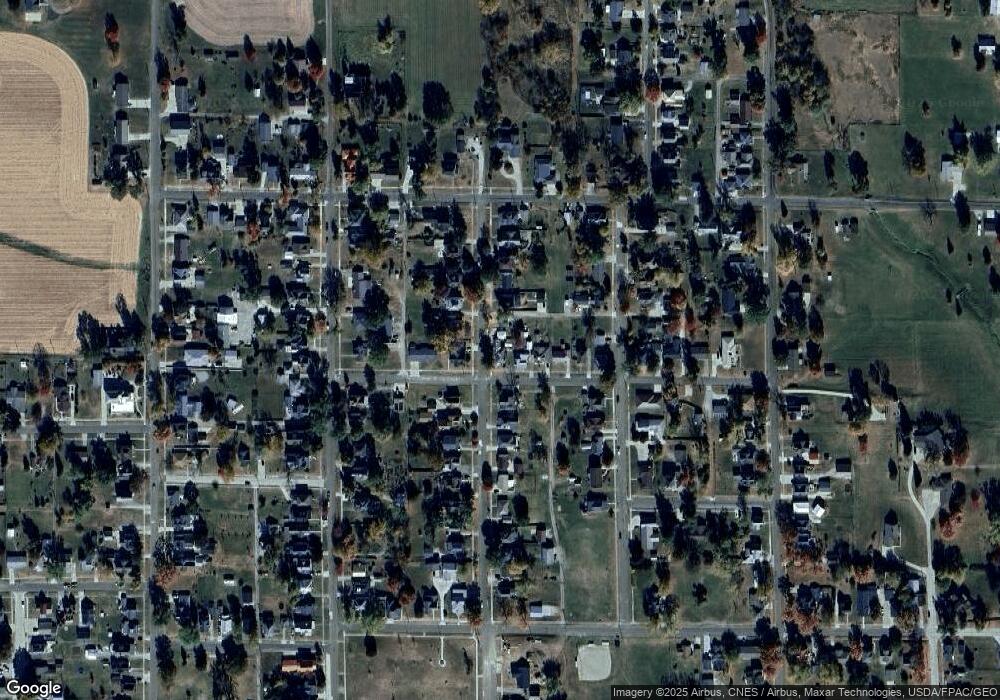
Map
Nearby Homes