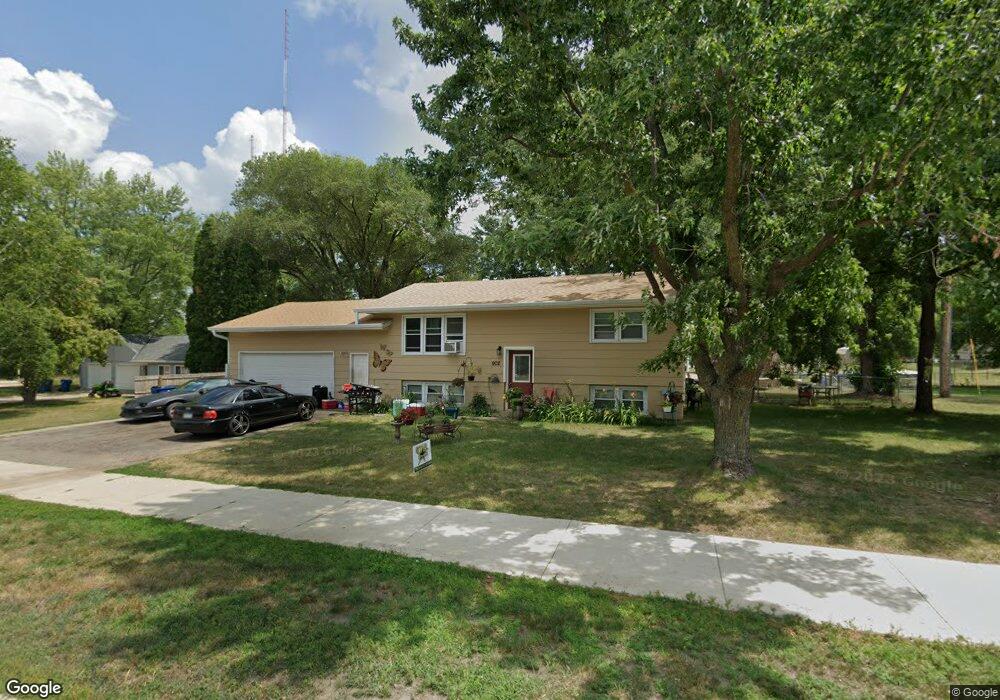
902 2nd St N Sauk Rapids, MN 56379
Estimated Value: $222,000 - $287,000
4
Beds
2
Baths
864
Sq Ft
$294/Sq Ft
Est. Value
About This Home
This home is located at 902 2nd St N, Sauk Rapids, MN 56379 and is currently estimated at $254,169, approximately $294 per square foot. 902 2nd St N is a home located in Benton County with nearby schools including Mississippi Heights Elementary School, Sauk Rapids-Rice Middle School, and Sauk Rapids-Rice Senior High School.
Ownership History
Date
Name
Owned For
Owner Type
Purchase Details
Closed on
May 25, 2018
Sold by
Real Assets Llc
Bought by
Christiason Jamie J
Current Estimated Value
Home Financials for this Owner
Home Financials are based on the most recent Mortgage that was taken out on this home.
Original Mortgage
$132,325
Outstanding Balance
$114,198
Interest Rate
4.5%
Mortgage Type
FHA
Estimated Equity
$139,971
Purchase Details
Closed on
Feb 19, 2016
Bought by
Christianson Jamie Jamie
Purchase Details
Closed on
Sep 10, 2010
Sold by
Real Assets Llc
Bought by
Pauls Cecilia
Purchase Details
Closed on
Jun 21, 2010
Sold by
Secretary Of Hud
Bought by
Real Assets Llc
Purchase Details
Closed on
Aug 3, 2009
Sold by
Wells Fargo Bank Na
Bought by
Secretary Of Hud Of Washington Dc
Create a Home Valuation Report for This Property
The Home Valuation Report is an in-depth analysis detailing your home's value as well as a comparison with similar homes in the area
Home Values in the Area
Average Home Value in this Area
Purchase History
| Date | Buyer | Sale Price | Title Company |
|---|---|---|---|
| Christiason Jamie J | $133,000 | T&S Title & Closing | |
| Christianson Jamie Jamie | $133,000 | -- | |
| Pauls Cecilia | -- | -- | |
| Real Assets Llc | -- | -- | |
| Secretary Of Hud Of Washington Dc | $87,036 | -- |
Source: Public Records
Mortgage History
| Date | Status | Borrower | Loan Amount |
|---|---|---|---|
| Open | Christiason Jamie J | $132,325 |
Source: Public Records
Tax History Compared to Growth
Tax History
| Year | Tax Paid | Tax Assessment Tax Assessment Total Assessment is a certain percentage of the fair market value that is determined by local assessors to be the total taxable value of land and additions on the property. | Land | Improvement |
|---|---|---|---|---|
| 2025 | $2,338 | $214,200 | $39,000 | $175,200 |
| 2024 | $2,302 | $205,700 | $39,000 | $166,700 |
| 2023 | $2,210 | $205,100 | $39,000 | $166,100 |
| 2022 | $2,092 | $182,800 | $35,500 | $147,300 |
| 2021 | $1,922 | $160,900 | $35,500 | $125,400 |
| 2018 | $1,724 | $111,100 | $27,836 | $83,264 |
| 2017 | $1,724 | $102,600 | $27,269 | $75,331 |
| 2016 | $1,690 | $126,400 | $34,100 | $92,300 |
| 2015 | $1,708 | $93,000 | $26,538 | $66,462 |
| 2014 | -- | $88,000 | $26,117 | $61,883 |
| 2013 | -- | $80,200 | $25,393 | $54,807 |
Source: Public Records
Map
Nearby Homes
- 216 8th Ave N
- 117 6th Ave N
- 112 Summit Ave S
- 100 9th Ave S
- 1105 Summit Ave N
- 1101 10th Ave N
- 1107 10th Ave N
- 1201 10th Ave N
- 615 3rd Ave N
- 752 12th St N
- 880 Golden Spike Rd NE
- XXXX Golden Spike Rd NE
- 970 Golden Spike Rd NE
- 224 9th St N
- 1406 Summit Ave N
- 314 Pleasant Ridge Dr
- 608 Summit Ave S
- 1018 N Benton Dr
- 1 Skyview Dr
- 1021 5th St S