Estimated Value: $654,000 - $715,000
4
Beds
3
Baths
2,952
Sq Ft
$233/Sq Ft
Est. Value
About This Home
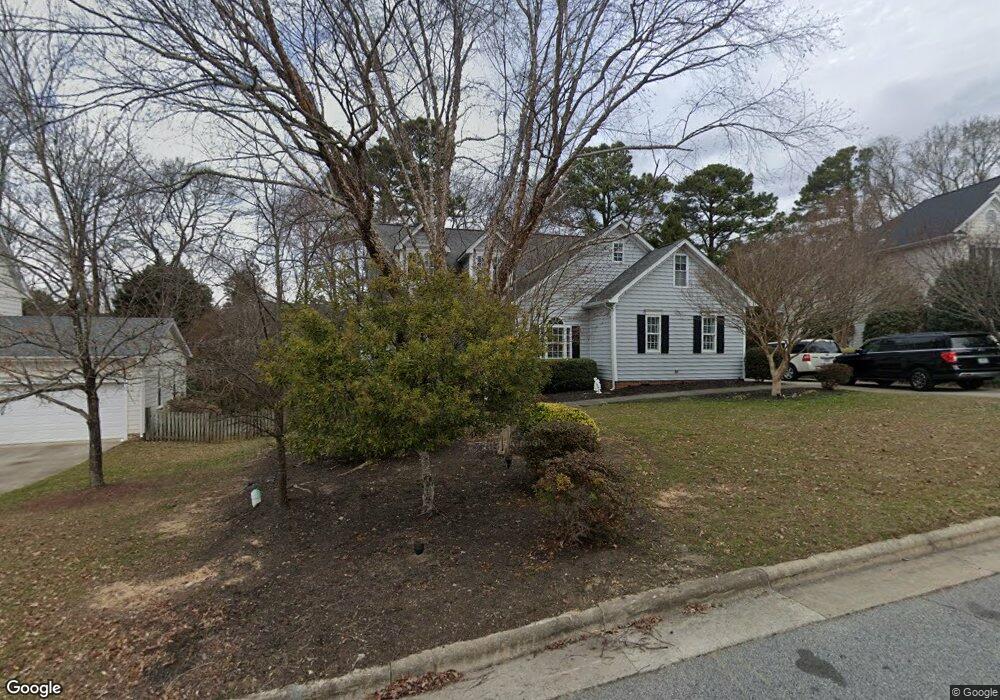
This home is located at 902 Brittley Way, Apex, NC 27502 and is currently estimated at $689,167, approximately $233 per square foot. 902 Brittley Way is a home located in Wake County with nearby schools including Salem Elementary, Salem Middle, and Apex High School.
Ownership History
Date
Name
Owned For
Owner Type
Purchase Details
Closed on
Nov 8, 2006
Sold by
Yount Cherry L
Bought by
Roof Kurt E and Roof Wendy A
Current Estimated Value
Home Financials for this Owner
Home Financials are based on the most recent Mortgage that was taken out on this home.
Original Mortgage
$240,000
Outstanding Balance
$142,440
Interest Rate
6.27%
Mortgage Type
Purchase Money Mortgage
Estimated Equity
$546,727
Purchase Details
Closed on
Mar 1, 2006
Sold by
Progress Properties Llc
Bought by
Yount Cherry L
Home Financials for this Owner
Home Financials are based on the most recent Mortgage that was taken out on this home.
Original Mortgage
$175,000
Interest Rate
8.99%
Mortgage Type
Fannie Mae Freddie Mac
Purchase Details
Closed on
Dec 5, 2003
Sold by
Yount Cherry L
Bought by
Progress Properties Llc
Home Financials for this Owner
Home Financials are based on the most recent Mortgage that was taken out on this home.
Original Mortgage
$170,000
Interest Rate
6.07%
Mortgage Type
Purchase Money Mortgage
Purchase Details
Closed on
Nov 10, 1999
Sold by
Park Homes Incorporated
Bought by
Yount Cherry L
Home Financials for this Owner
Home Financials are based on the most recent Mortgage that was taken out on this home.
Original Mortgage
$129,775
Interest Rate
9.25%
Create a Home Valuation Report for This Property
The Home Valuation Report is an in-depth analysis detailing your home's value as well as a comparison with similar homes in the area
Home Values in the Area
Average Home Value in this Area
Purchase History
| Date | Buyer | Sale Price | Title Company |
|---|---|---|---|
| Roof Kurt E | $300,000 | None Available | |
| Yount Cherry L | $170,000 | None Available | |
| Progress Properties Llc | $154,000 | -- | |
| Yount Cherry L | $179,000 | -- |
Source: Public Records
Mortgage History
| Date | Status | Borrower | Loan Amount |
|---|---|---|---|
| Open | Roof Kurt E | $240,000 | |
| Previous Owner | Yount Cherry L | $175,000 | |
| Previous Owner | Progress Properties Llc | $170,000 | |
| Previous Owner | Yount Cherry L | $129,775 |
Source: Public Records
Tax History Compared to Growth
Tax History
| Year | Tax Paid | Tax Assessment Tax Assessment Total Assessment is a certain percentage of the fair market value that is determined by local assessors to be the total taxable value of land and additions on the property. | Land | Improvement |
|---|---|---|---|---|
| 2025 | $5,430 | $619,579 | $170,000 | $449,579 |
| 2024 | $5,308 | $619,579 | $170,000 | $449,579 |
| 2023 | $4,500 | $408,416 | $90,000 | $318,416 |
| 2022 | $4,225 | $408,416 | $90,000 | $318,416 |
| 2021 | $4,063 | $408,416 | $90,000 | $318,416 |
| 2020 | $4,022 | $408,416 | $90,000 | $318,416 |
| 2019 | $3,825 | $334,999 | $90,000 | $244,999 |
| 2018 | $3,602 | $334,999 | $90,000 | $244,999 |
| 2017 | $3,353 | $334,999 | $90,000 | $244,999 |
| 2016 | $3,305 | $334,999 | $90,000 | $244,999 |
| 2015 | $3,249 | $321,473 | $74,000 | $247,473 |
| 2014 | $3,132 | $321,473 | $74,000 | $247,473 |
Source: Public Records
Map
Nearby Homes
- 303 Knightsborough Way
- 907 Haddon Hall Dr
- 919 Branch Line Ln
- 953 Ambergate Station
- 1111 Platform Dr
- 1115 Platform Dr
- 1209 Haywards Heath Ln
- 102 Darley Dale Loop
- 232 Eyam Hall Ln
- 235 Eyam Hall Ln
- 996 Tender Dr
- 427 Eyam Hall Ln
- 506 W Chatham St
- 547 Grand Central Station
- 596 Grand Central Station
- 1808 N Salem St
- 7736 Roberts Rd
- 903 Norwood Ln
- 202 W Chatham St
- 105 Troyer Place
- 904 Brittley Way
- 900 Brittley Way
- 906 Brittley Way
- 898 Brittley Way
- 901 Brittley Way
- 1006 Rexhill Ct
- 2001 Charlion Downs Ln
- 905 Brittley Way
- 1008 Rexhill Ct
- 908 Brittley Way
- 1000 Rexhill Ct
- 2003 Charlion Downs Ln
- 909 Brittley Way
- 910 Brittley Way
- 2005 Charlion Downs Ln
- 1010 Rexhill Ct
- 1904 Charlion Downs Ln
- 1902 Charlion Downs Ln
- 1007 Rexhill Ct
- 1005 Rexhill Ct