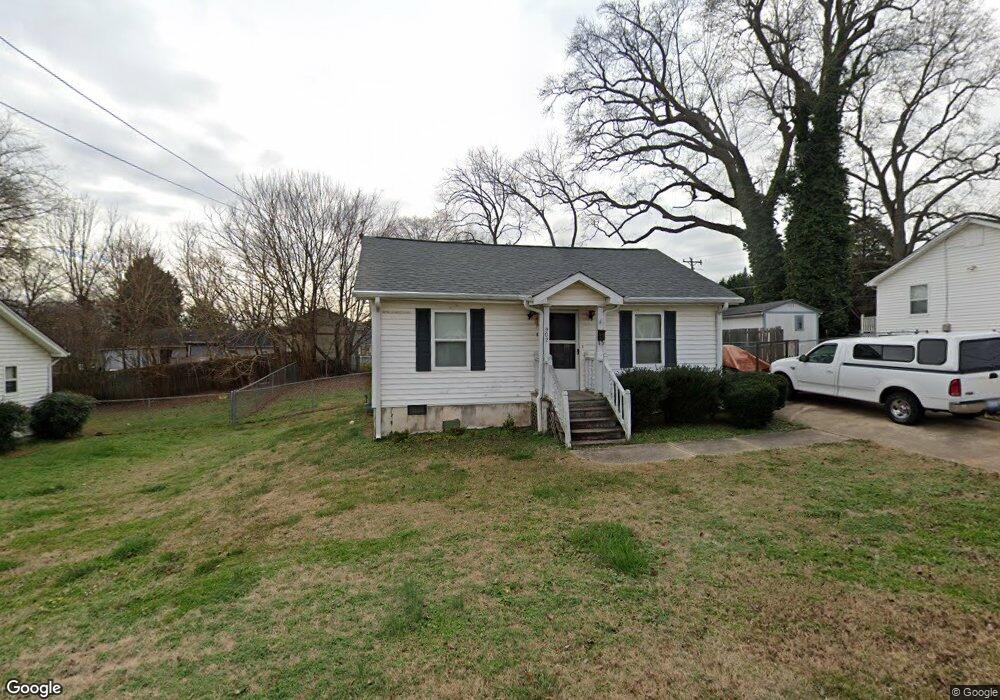
902 Brook St Belmont, NC 28012
Estimated Value: $203,000 - $233,000
2
Beds
1
Bath
742
Sq Ft
$298/Sq Ft
Est. Value
About This Home
This home is located at 902 Brook St, Belmont, NC 28012 and is currently estimated at $221,274, approximately $298 per square foot. 902 Brook St is a home located in Gaston County with nearby schools including J B Page Elementary School, Belmont Central Elementary School, and Belmont Middle School.
Ownership History
Date
Name
Owned For
Owner Type
Purchase Details
Closed on
Dec 11, 2019
Sold by
Joseph Randall Realty Llc
Bought by
Mcbride Mark A and Reid Melinda P
Current Estimated Value
Home Financials for this Owner
Home Financials are based on the most recent Mortgage that was taken out on this home.
Original Mortgage
$110,500
Outstanding Balance
$97,612
Interest Rate
3.7%
Mortgage Type
New Conventional
Estimated Equity
$123,662
Purchase Details
Closed on
Nov 5, 2019
Sold by
Jem Star Llc
Bought by
Joseph Randall Realty Llc
Home Financials for this Owner
Home Financials are based on the most recent Mortgage that was taken out on this home.
Original Mortgage
$110,500
Outstanding Balance
$97,612
Interest Rate
3.7%
Mortgage Type
New Conventional
Estimated Equity
$123,662
Purchase Details
Closed on
Apr 20, 2016
Sold by
Black Mountain Penland Properties Llc
Bought by
Jem Star Llc
Create a Home Valuation Report for This Property
The Home Valuation Report is an in-depth analysis detailing your home's value as well as a comparison with similar homes in the area
Home Values in the Area
Average Home Value in this Area
Purchase History
| Date | Buyer | Sale Price | Title Company |
|---|---|---|---|
| Mcbride Mark A | $130,000 | None Available | |
| Joseph Randall Realty Llc | $112,000 | None Available | |
| Jem Star Llc | -- | None Available |
Source: Public Records
Mortgage History
| Date | Status | Borrower | Loan Amount |
|---|---|---|---|
| Open | Mcbride Mark A | $110,500 |
Source: Public Records
Tax History Compared to Growth
Tax History
| Year | Tax Paid | Tax Assessment Tax Assessment Total Assessment is a certain percentage of the fair market value that is determined by local assessors to be the total taxable value of land and additions on the property. | Land | Improvement |
|---|---|---|---|---|
| 2025 | $2,043 | $193,850 | $55,000 | $138,850 |
| 2024 | $2,043 | $193,850 | $55,000 | $138,850 |
| 2023 | $2,065 | $193,850 | $55,000 | $138,850 |
| 2022 | $1,252 | $95,960 | $22,500 | $73,460 |
| 2021 | $1,291 | $95,960 | $22,500 | $73,460 |
| 2019 | $1,300 | $95,960 | $22,500 | $73,460 |
| 2018 | $875 | $63,198 | $14,400 | $48,798 |
| 2017 | $850 | $63,198 | $14,400 | $48,798 |
| 2016 | $850 | $63,198 | $0 | $0 |
| 2014 | $877 | $65,222 | $18,000 | $47,222 |
Source: Public Records
Map
Nearby Homes
- 901 Edgemont Ave
- 1 Linestowe Dr
- 201 Sloan St
- 70 Volk St
- 204 13th St
- 206 13th St
- 405 Linestowe Dr
- 318 6th St
- 5949 Gilchrist Cir
- 302 Planetree Dr
- 1213 Sandra Ct
- 5 S 1st St
- 203 Ewing Dr
- 5141 Bright Rd
- 4830 Samuel Pinckney Dr
- 104 Mckee Cir
- 6828 Wilkinson Blvd
- 201 Browntown Rd
- 4813 Samuel Pinckney Dr
- 6030 Thorburn Way