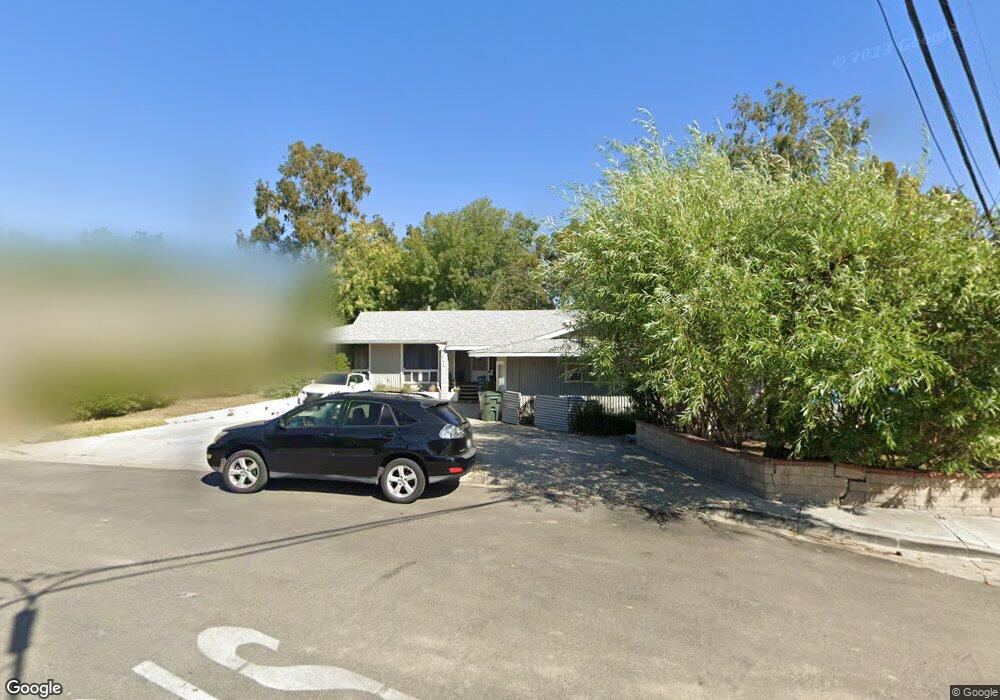
902 Brossard Dr Thousand Oaks, CA 91360
Estimated Value: $1,256,590 - $1,310,000
3
Beds
4
Baths
3,738
Sq Ft
$344/Sq Ft
Est. Value
About This Home
This home is located at 902 Brossard Dr, Thousand Oaks, CA 91360 and is currently estimated at $1,284,148, approximately $343 per square foot. 902 Brossard Dr is a home located in Ventura County with nearby schools including Glenwood Elementary School, Colina Middle School, and Westlake High School.
Ownership History
Date
Name
Owned For
Owner Type
Purchase Details
Closed on
Sep 25, 2000
Sold by
Nuno Martins and Nuno Roe A
Bought by
Iversen Theodore Dennis
Current Estimated Value
Home Financials for this Owner
Home Financials are based on the most recent Mortgage that was taken out on this home.
Original Mortgage
$252,700
Outstanding Balance
$92,025
Interest Rate
7.9%
Estimated Equity
$1,192,123
Purchase Details
Closed on
Oct 12, 1995
Sold by
Lasley Douglas D and Lasley Marilynn F
Bought by
Martins Nuno and Martins Roe Anne
Home Financials for this Owner
Home Financials are based on the most recent Mortgage that was taken out on this home.
Original Mortgage
$158,400
Interest Rate
7.58%
Purchase Details
Closed on
Oct 14, 1993
Sold by
Lasley Doug and Lasley Marilynn F
Bought by
Lasley Steven
Home Financials for this Owner
Home Financials are based on the most recent Mortgage that was taken out on this home.
Original Mortgage
$25,000
Interest Rate
6.88%
Create a Home Valuation Report for This Property
The Home Valuation Report is an in-depth analysis detailing your home's value as well as a comparison with similar homes in the area
Home Values in the Area
Average Home Value in this Area
Purchase History
| Date | Buyer | Sale Price | Title Company |
|---|---|---|---|
| Iversen Theodore Dennis | $330,000 | Lawyers Title Company | |
| Martins Nuno | $198,000 | Continental Lawyers Title | |
| Lasley Steven | -- | Lincoln Title Co |
Source: Public Records
Mortgage History
| Date | Status | Borrower | Loan Amount |
|---|---|---|---|
| Open | Iversen Theodore Dennis | $252,700 | |
| Previous Owner | Martins Nuno | $158,400 | |
| Previous Owner | Lasley Steven | $25,000 |
Source: Public Records
Tax History Compared to Growth
Tax History
| Year | Tax Paid | Tax Assessment Tax Assessment Total Assessment is a certain percentage of the fair market value that is determined by local assessors to be the total taxable value of land and additions on the property. | Land | Improvement |
|---|---|---|---|---|
| 2025 | $5,565 | $497,233 | $210,948 | $286,285 |
| 2024 | $5,565 | $487,484 | $206,812 | $280,672 |
| 2023 | $5,394 | $477,926 | $202,757 | $275,169 |
| 2022 | $5,297 | $468,555 | $198,781 | $269,774 |
| 2021 | $5,206 | $459,368 | $194,883 | $264,485 |
| 2020 | $4,784 | $454,660 | $192,886 | $261,774 |
| 2019 | $4,657 | $445,746 | $189,104 | $256,642 |
| 2018 | $4,563 | $437,007 | $185,397 | $251,610 |
| 2017 | $4,474 | $428,439 | $181,762 | $246,677 |
| 2016 | $4,432 | $420,040 | $178,199 | $241,841 |
| 2015 | $4,354 | $413,732 | $175,523 | $238,209 |
| 2014 | $4,291 | $405,630 | $172,086 | $233,544 |
Source: Public Records
Map
Nearby Homes
- 978 Bower Way
- 245 Houston Dr
- 647 Brossard Dr
- 1000 E Thousand Oaks Blvd
- 566 Rancho Rd
- 1340 E Hillcrest Dr Unit 8
- 1342 E Hillcrest Dr Unit 20
- 1248 La Peresa Dr
- 918 Rancho Rd
- 110 Maegan Place Unit 13
- 1649 Hauser Cir
- 68 Maegan Place Unit 7
- 62 Maegan Place Unit 4
- 331 Dryden St
- 86 Maegan Place Unit 4
- 932 Rosario Dr
- 56 Maegan Place Unit 4
- 1710 E Thousand Oaks Blvd
- 1116 Rexford Place
- 96 Erbes Rd
- 346 Houston Dr
- 910 Brossard Dr
- 358 Houston Dr
- 391 Houston Dr
- 430 Houston Dr
- 884 Brossard Dr
- 918 Brossard Dr
- 411 Houston Dr
- 334 Houston Dr
- 423 Houston Dr
- 897 Vinton Ct
- 872 Brossard Dr
- 446 Houston Dr
- 322 Houston Dr
- 435 Houston Dr
- 338 Houston Dr
- 860 Brossard Dr
- 342 Houston Dr
- 458 Houston Dr
- 441 Houston Dr