
Seller's Agent in 2026
Judy Kasso
Realty ONE Group Champion - Perkins
(801) 824-8166
71 Total Sales
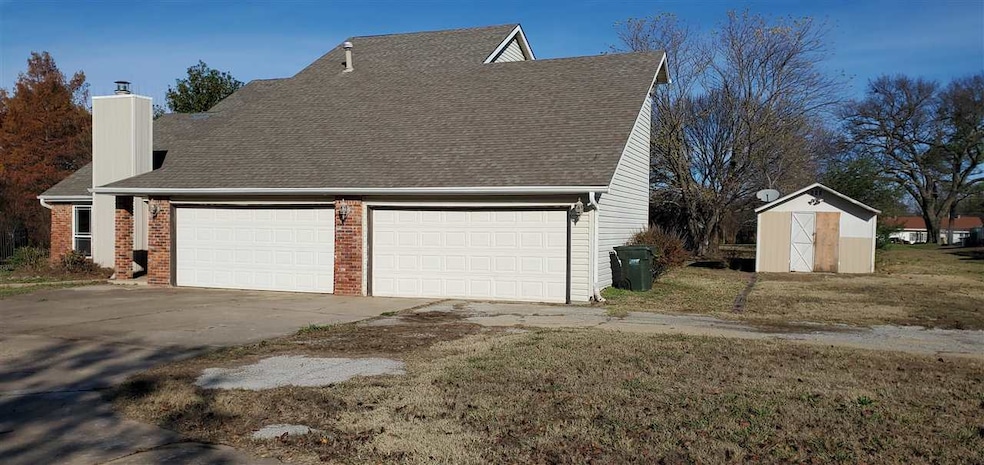
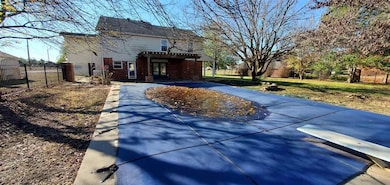
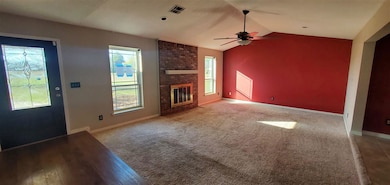
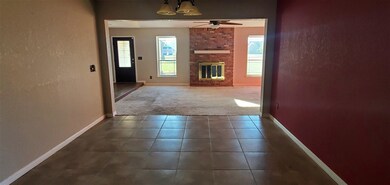
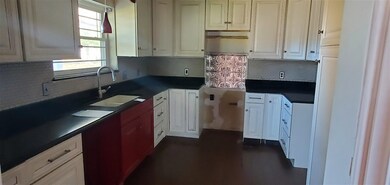
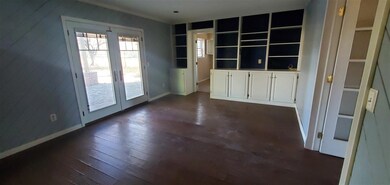
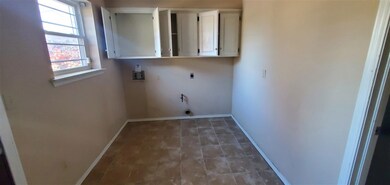
A true HUD value! Large 1.5 story home situated on 1.54 acre lot with an inground swimming pool and brick patio. This property is located in a desirable neighborhood of similar homes. 4 spacious bedroom and 2 bonus room, 3.5 baths plus family room and dining room. Oversized 2 car garage and storage shed. All HUD homes are sold AS IS. Case# 405-021919 www.HudHomeStore.gov
Last Agent to Sell the Property
Realty ONE Group Champion - Perkins License #134393 Listed on: 12/05/2025
Last Buyer's Agent
Realty ONE Group Champion - Perkins License #134393 Listed on: 12/05/2025
| Date | Type | Sale Price | Title Company |
|---|---|---|---|
| Sheriffs Deed | $139,000 | None Listed On Document | |
| Special Warranty Deed | -- | None Listed On Document | |
| Special Warranty Deed | -- | None Listed On Document | |
| Warranty Deed | $180,500 | None Available |
| Date | Status | Loan Amount | Loan Type |
|---|---|---|---|
| Previous Owner | $180,250 | New Conventional |
| Date | Event | Price | List to Sale | Price per Sq Ft |
|---|---|---|---|---|
| 02/26/2026 02/26/26 | Sold | $237,101 | 0.0% | $97 / Sq Ft |
| 12/08/2025 12/08/25 | Pending | -- | -- | -- |
| 12/05/2025 12/05/25 | For Sale | $237,000 | -- | $97 / Sq Ft |
| Year | Tax Paid | Tax Assessment Tax Assessment Total Assessment is a certain percentage of the fair market value that is determined by local assessors to be the total taxable value of land and additions on the property. | Land | Improvement |
|---|---|---|---|---|
| 2025 | $2,705 | $31,039 | $5,185 | $25,854 |
| 2024 | $2,631 | $31,039 | $5,185 | $25,854 |
| 2023 | $2,631 | $23,358 | $3,113 | $20,245 |
| 2022 | $1,848 | $22,678 | $3,434 | $19,244 |
| 2021 | $1,744 | $22,017 | $3,571 | $18,446 |
| 2020 | $1,668 | $21,376 | $3,739 | $17,637 |
| 2019 | $1,690 | $20,753 | $2,917 | $17,836 |
| 2018 | $1,638 | $20,753 | $2,917 | $17,836 |
| 2017 | $1,625 | $20,754 | $2,917 | $17,837 |
| 2016 | $1,670 | $20,753 | $2,917 | $17,836 |
| 2015 | $1,660 | $20,169 | $1,183 | $18,986 |
| 2014 | $1,652 | $20,169 | $1,183 | $18,986 |
Seller's Agent in 2026
Judy Kasso
Realty ONE Group Champion - Perkins
(801) 824-8166
71 Total Sales
Source: Stillwater Board of REALTORS®
MLS Number: 133314
APN: 600003292
Disclaimer: Certain information contained herein is derived from information provided by parties other than Homes.com. All information provided is deemed reliable, but is not guaranteed to be accurate and should be independently verified.
![]() IDX information is provided exclusively for personal, non-commercial use, and may not be used for any purpose other than to identify prospective properties consumers may be interested in purchasing. Information is deemed reliable but not guaranteed.
IDX information is provided exclusively for personal, non-commercial use, and may not be used for any purpose other than to identify prospective properties consumers may be interested in purchasing. Information is deemed reliable but not guaranteed.
Ask me questions while you tour the home.