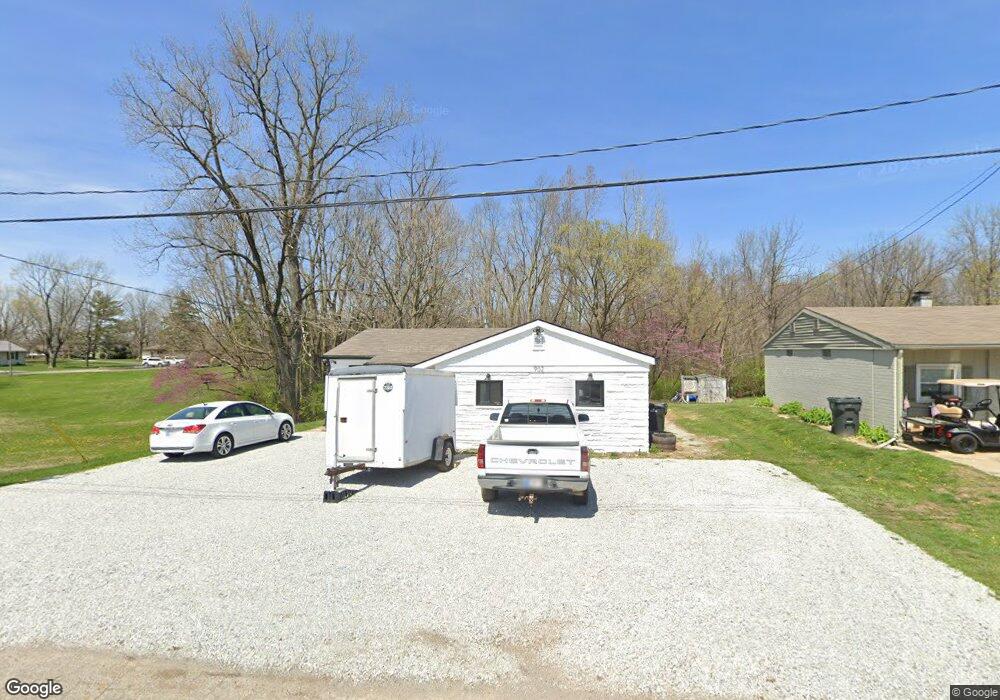
902 E Maple St Frankton, IN 46044
Estimated Value: $133,000 - $192,000
2
Beds
1
Bath
1,400
Sq Ft
$111/Sq Ft
Est. Value
About This Home
This home is located at 902 E Maple St, Frankton, IN 46044 and is currently estimated at $156,060, approximately $111 per square foot. 902 E Maple St is a home with nearby schools including Frankton Elementary School and Frankton Junior/Senior High School.
Ownership History
Date
Name
Owned For
Owner Type
Purchase Details
Closed on
Jan 31, 2025
Sold by
Rastetter Matthew W
Bought by
Kinsey Chase and Kinsey Ashtyn
Current Estimated Value
Home Financials for this Owner
Home Financials are based on the most recent Mortgage that was taken out on this home.
Original Mortgage
$117,000
Outstanding Balance
$115,961
Interest Rate
6.72%
Mortgage Type
New Conventional
Estimated Equity
$40,099
Purchase Details
Closed on
Apr 18, 2024
Sold by
Barnett Michael
Bought by
Rastetter Matthew W
Create a Home Valuation Report for This Property
The Home Valuation Report is an in-depth analysis detailing your home's value as well as a comparison with similar homes in the area
Home Values in the Area
Average Home Value in this Area
Purchase History
| Date | Buyer | Sale Price | Title Company |
|---|---|---|---|
| Kinsey Chase | -- | Rowland Title | |
| Rastetter Matthew W | $85,000 | Rowland Title |
Source: Public Records
Mortgage History
| Date | Status | Borrower | Loan Amount |
|---|---|---|---|
| Open | Kinsey Chase | $117,000 |
Source: Public Records
Tax History
| Year | Tax Paid | Tax Assessment Tax Assessment Total Assessment is a certain percentage of the fair market value that is determined by local assessors to be the total taxable value of land and additions on the property. | Land | Improvement |
|---|---|---|---|---|
| 2025 | $836 | $103,800 | $10,500 | $93,300 |
| 2024 | $836 | $92,800 | $10,500 | $82,300 |
| 2023 | $567 | $73,100 | $10,000 | $63,100 |
| 2022 | $655 | $74,500 | $9,300 | $65,200 |
| 2021 | $534 | $69,000 | $9,300 | $59,700 |
| 2020 | $518 | $62,400 | $8,800 | $53,600 |
| 2019 | $486 | $60,800 | $8,800 | $52,000 |
| 2018 | $508 | $57,600 | $8,800 | $48,800 |
| 2017 | $502 | $60,200 | $8,800 | $51,400 |
| 2016 | $441 | $54,700 | $8,800 | $45,900 |
| 2014 | $444 | $53,900 | $8,800 | $45,100 |
| 2013 | $444 | $53,900 | $8,800 | $45,100 |
Source: Public Records
Map
Nearby Homes
Your Personal Tour Guide
Ask me questions while you tour the home.