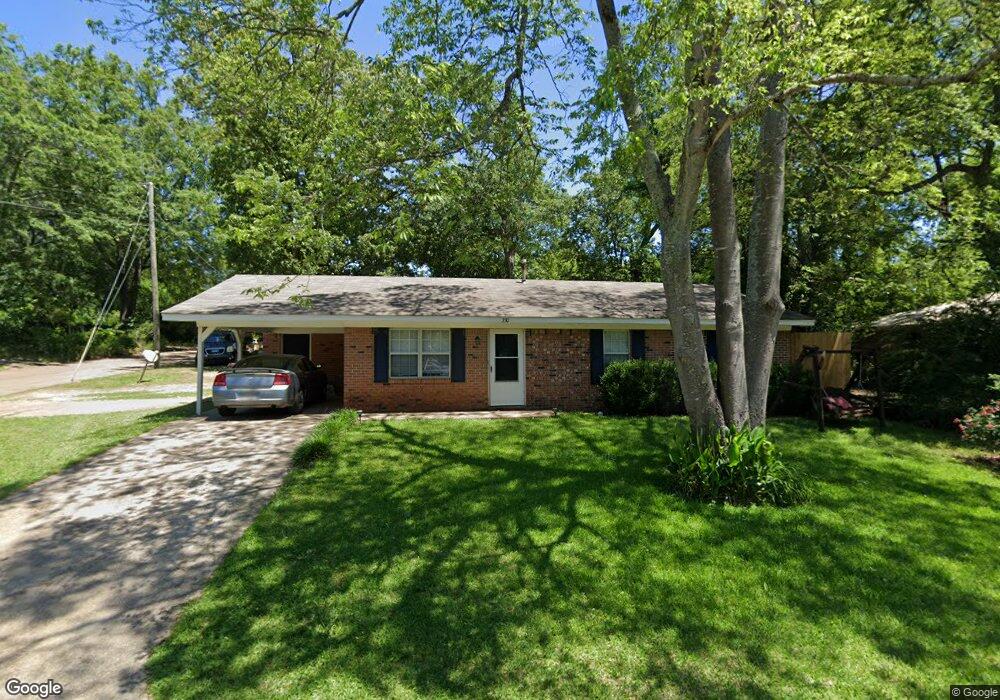
902 Grove St West Point, MS 39773
Estimated Value: $111,000 - $118,000
3
Beds
--
Bath
1,263
Sq Ft
$92/Sq Ft
Est. Value
About This Home
This home is located at 902 Grove St, West Point, MS 39773 and is currently estimated at $115,803, approximately $91 per square foot. 902 Grove St is a home located in Clay County with nearby schools including East Side Elementary School, West Clay Elementary School, and Church Hill Elementary School.
Ownership History
Date
Name
Owned For
Owner Type
Purchase Details
Closed on
Sep 16, 2020
Sold by
Reily Kendall
Bought by
Butts Marquita
Current Estimated Value
Home Financials for this Owner
Home Financials are based on the most recent Mortgage that was taken out on this home.
Original Mortgage
$85,757
Outstanding Balance
$75,931
Interest Rate
2.9%
Mortgage Type
Unknown
Estimated Equity
$39,872
Purchase Details
Closed on
Feb 24, 2020
Sold by
Usag Rural Housing Service
Bought by
Reily Kendall
Create a Home Valuation Report for This Property
The Home Valuation Report is an in-depth analysis detailing your home's value as well as a comparison with similar homes in the area
Home Values in the Area
Average Home Value in this Area
Purchase History
| Date | Buyer | Sale Price | Title Company |
|---|---|---|---|
| Butts Marquita | -- | -- | |
| Reily Kendall | $36,200 | -- |
Source: Public Records
Mortgage History
| Date | Status | Borrower | Loan Amount |
|---|---|---|---|
| Open | Butts Marquita | $85,757 |
Source: Public Records
Tax History Compared to Growth
Tax History
| Year | Tax Paid | Tax Assessment Tax Assessment Total Assessment is a certain percentage of the fair market value that is determined by local assessors to be the total taxable value of land and additions on the property. | Land | Improvement |
|---|---|---|---|---|
| 2024 | $217 | $6,372 | $731 | $5,641 |
| 2023 | $580 | $5,315 | $731 | $4,584 |
| 2022 | $184 | $5,315 | $731 | $4,584 |
| 2021 | $183 | $5,315 | $731 | $4,584 |
| 2020 | $438 | $7,973 | $1,097 | $6,876 |
| 2019 | $406 | $7,912 | $1,097 | $6,815 |
| 2018 | $390 | $7,912 | $1,097 | $6,815 |
| 2017 | $390 | $7,912 | $1,097 | $6,815 |
| 2016 | -- | $5,274 | $731 | $4,543 |
| 2015 | $342 | $6,851 | $1,097 | $5,754 |
| 2014 | $311 | $6,851 | $1,097 | $5,754 |
| 2013 | $311 | $6,851 | $1,097 | $5,754 |
Source: Public Records
Map
Nearby Homes
- 346 E Brame Ave
- 402 Cromwell St
- 206 S Division St
- 228 S Division St
- 229 S Division St
- 98 Court St
- 238 Calhoun St
- 184 Tournament St
- 159 Washington St
- 479 E Westbrook St
- 480 E Westbrook St
- 485 E Westbrook St
- 1046 E Brame Ave
- 15 David St
- 551 E Westbrook St
- 1104 E Broad St
- 20 Beverly Dr
- 0 Hwy 45 Alt N
- 1180 E Broad St
- 26788 E Main St