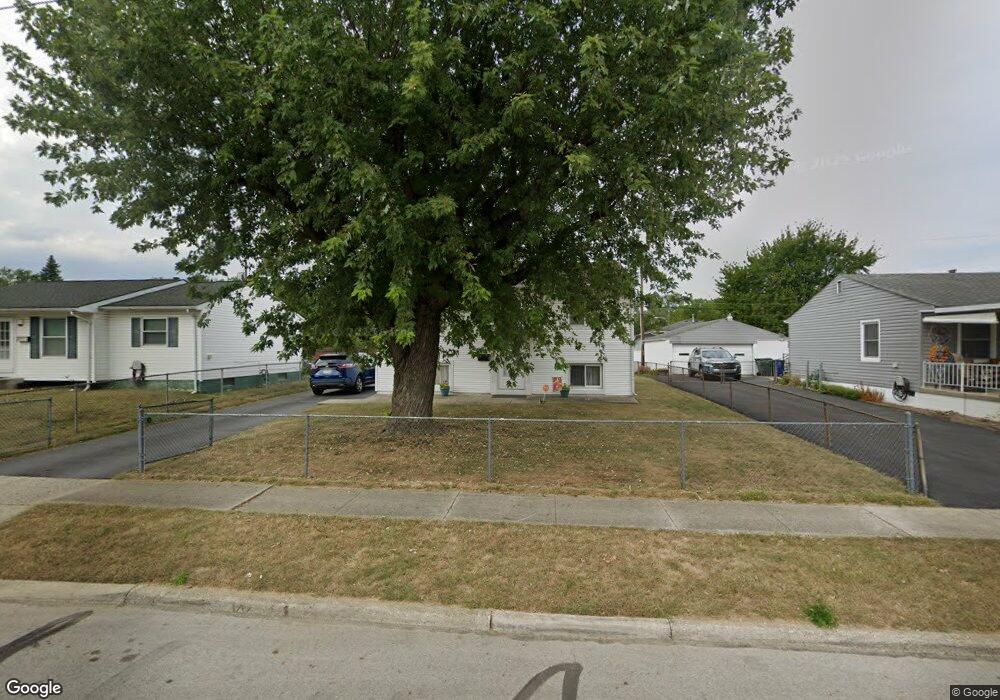
902 Higbee Dr N Columbus, OH 43207
Obetz-Lockbourne NeighborhoodEstimated Value: $177,000 - $204,000
3
Beds
2
Baths
780
Sq Ft
$242/Sq Ft
Est. Value
About This Home
This home is located at 902 Higbee Dr N, Columbus, OH 43207 and is currently estimated at $188,667, approximately $241 per square foot. 902 Higbee Dr N is a home located in Franklin County with nearby schools including Hamilton Elementary School, Hamilton Intermediate School, and Hamilton Middle School.
Ownership History
Date
Name
Owned For
Owner Type
Purchase Details
Closed on
Oct 10, 2006
Sold by
Lemay Kenneth E and Lemay Bobbie W
Bought by
Lemay Kenneth E and Lemay Bobbie W
Current Estimated Value
Home Financials for this Owner
Home Financials are based on the most recent Mortgage that was taken out on this home.
Original Mortgage
$120,000
Interest Rate
6.41%
Mortgage Type
New Conventional
Purchase Details
Closed on
Nov 13, 2003
Sold by
Lemay Kenneth E and Lemay Bobbie W
Bought by
Lemay Kenneth E and Lemay Bobbie W
Purchase Details
Closed on
Jun 24, 2002
Sold by
Lemay Kenneth E and Lemay Wilda J
Bought by
Lemay Kenneth E and Lemay Bobbie W
Purchase Details
Closed on
Apr 28, 1986
Bought by
Lemay Kenneth E and Lemay Wilda J
Create a Home Valuation Report for This Property
The Home Valuation Report is an in-depth analysis detailing your home's value as well as a comparison with similar homes in the area
Home Values in the Area
Average Home Value in this Area
Purchase History
| Date | Buyer | Sale Price | Title Company |
|---|---|---|---|
| Lemay Kenneth E | -- | Benchmark Escrow & Title Llc | |
| Lemay Kenneth E | -- | -- | |
| Lemay Bobbie W | -- | -- | |
| Lemay Kenneth E | -- | -- | |
| Lemay Kenneth E | -- | -- |
Source: Public Records
Mortgage History
| Date | Status | Borrower | Loan Amount |
|---|---|---|---|
| Closed | Lemay Kenneth E | $120,000 |
Source: Public Records
Tax History Compared to Growth
Tax History
| Year | Tax Paid | Tax Assessment Tax Assessment Total Assessment is a certain percentage of the fair market value that is determined by local assessors to be the total taxable value of land and additions on the property. | Land | Improvement |
|---|---|---|---|---|
| 2024 | $1,619 | $51,800 | $12,950 | $38,850 |
| 2023 | $1,617 | $51,800 | $12,950 | $38,850 |
| 2022 | $988 | $32,420 | $8,860 | $23,560 |
| 2021 | $1,004 | $32,420 | $8,860 | $23,560 |
| 2020 | $1,027 | $32,420 | $8,860 | $23,560 |
| 2019 | $871 | $27,060 | $7,390 | $19,670 |
| 2018 | $928 | $27,060 | $7,390 | $19,670 |
| 2017 | $881 | $27,060 | $7,390 | $19,670 |
| 2016 | $978 | $27,760 | $5,460 | $22,300 |
| 2015 | $991 | $27,760 | $5,460 | $22,300 |
| 2014 | $994 | $27,760 | $5,460 | $22,300 |
| 2013 | $521 | $29,190 | $5,740 | $23,450 |
Source: Public Records
Map
Nearby Homes
- 864 Robmeyer Dr
- 3573 S Champion Ave
- 989 Lavender Ln
- 904 Kyle Ave
- 0 Williams Rd
- 965 Radbourne Dr
- 1068 Tobi Dr
- 1118 Maplewood Rd
- 1091 Vernon Dr
- 1085 Williams Rd
- 696 Williams Rd
- 3735 Christie Rd W
- 3940 Hillman Rd W
- 1101 Meadow Ln
- 3691 Abney Rd
- 3691 Ferman Rd
- 812 Breathitt Ave
- 4451 1/2 Lockbourne Rd Unit R
- 4207 Crosspointe Dr
- 525 Ashwood Rd
- 894 Higbee Dr N
- 908 Higbee Dr N
- 886 Higbee Dr N
- 895 Allison Dr
- 916 Higbee Dr N
- 887 Allison Dr
- 901 Allison Dr
- 881 Allison Dr
- 911 Allison Dr
- 901 Higbee Dr N
- 880 Higbee Dr N
- 922 Higbee Dr N
- 895 Higbee Dr N
- 915 Higbee Dr N
- 873 Allison Dr
- 887 Higbee Dr N
- 917 Allison Dr
- 874 Higbee Dr N
- 923 Higbee Dr N
- 930 Higbee Dr N