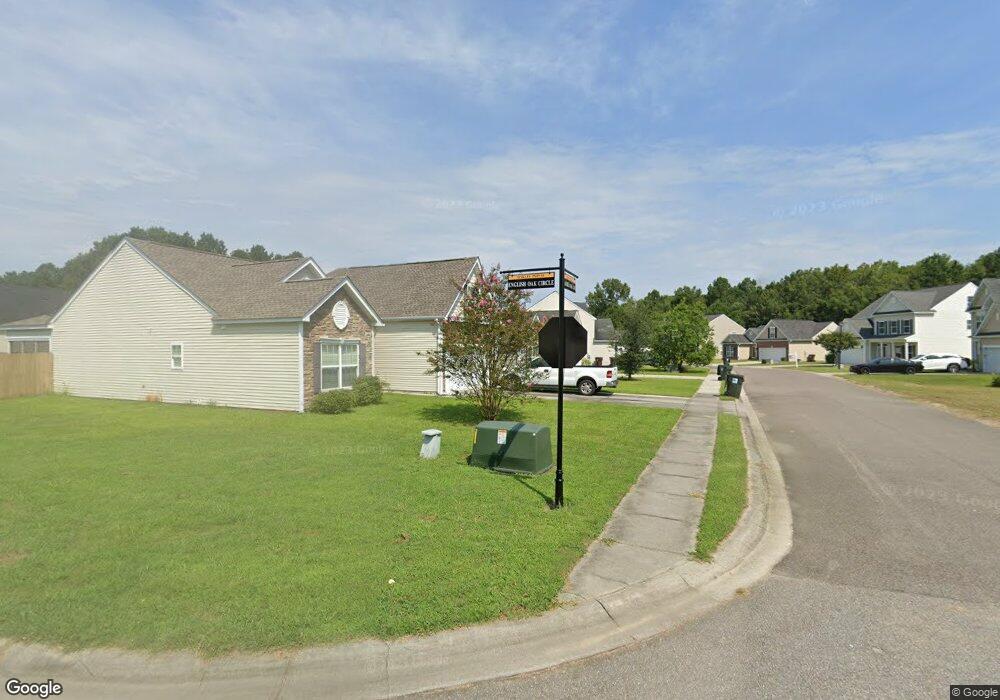
902 Laurel Oak Ln Moncks Corner, SC 29461
Estimated Value: $281,000 - $325,000
3
Beds
2
Baths
1,400
Sq Ft
$213/Sq Ft
Est. Value
About This Home
This home is located at 902 Laurel Oak Ln, Moncks Corner, SC 29461 and is currently estimated at $298,184, approximately $212 per square foot. 902 Laurel Oak Ln is a home located in Berkeley County with nearby schools including Moncks Corner Elementary School, Berkeley Middle School, and Berkeley High School.
Ownership History
Date
Name
Owned For
Owner Type
Purchase Details
Closed on
Nov 9, 2020
Sold by
White Allyson and Clark Allyson
Bought by
White Allyson and White Clifton
Current Estimated Value
Home Financials for this Owner
Home Financials are based on the most recent Mortgage that was taken out on this home.
Original Mortgage
$141,729
Outstanding Balance
$114,129
Interest Rate
2.7%
Mortgage Type
New Conventional
Estimated Equity
$184,055
Purchase Details
Closed on
Nov 29, 2011
Sold by
Eastwood Construction Llc
Bought by
Clark Allyson
Home Financials for this Owner
Home Financials are based on the most recent Mortgage that was taken out on this home.
Original Mortgage
$138,270
Interest Rate
4.15%
Mortgage Type
New Conventional
Purchase Details
Closed on
Sep 6, 2011
Sold by
Oakley Pointe Llc
Bought by
Eastwood Construction Llc
Create a Home Valuation Report for This Property
The Home Valuation Report is an in-depth analysis detailing your home's value as well as a comparison with similar homes in the area
Home Values in the Area
Average Home Value in this Area
Purchase History
| Date | Buyer | Sale Price | Title Company |
|---|---|---|---|
| White Allyson | -- | Boston National Ttl Agcy Llc | |
| Clark Allyson | $135,505 | -- | |
| Eastwood Construction Llc | -- | -- |
Source: Public Records
Mortgage History
| Date | Status | Borrower | Loan Amount |
|---|---|---|---|
| Open | White Allyson | $141,729 | |
| Closed | Clark Allyson | $138,270 |
Source: Public Records
Tax History Compared to Growth
Tax History
| Year | Tax Paid | Tax Assessment Tax Assessment Total Assessment is a certain percentage of the fair market value that is determined by local assessors to be the total taxable value of land and additions on the property. | Land | Improvement |
|---|---|---|---|---|
| 2025 | $3,261 | $169,016 | $39,490 | $129,526 |
| 2024 | $3,261 | $10,141 | $2,369 | $7,772 |
| 2023 | $3,261 | $10,141 | $2,369 | $7,772 |
| 2022 | $3,098 | $8,818 | $2,105 | $6,713 |
| 2021 | $3,022 | $8,820 | $2,105 | $6,713 |
| 2020 | $3,069 | $8,818 | $2,105 | $6,713 |
| 2019 | $1,162 | $5,878 | $1,403 | $4,475 |
| 2018 | $1,015 | $5,112 | $1,440 | $3,672 |
| 2017 | $1,018 | $5,112 | $1,440 | $3,672 |
| 2016 | $880 | $5,110 | $1,440 | $3,670 |
| 2015 | $763 | $5,110 | $1,440 | $3,670 |
| 2014 | $752 | $5,110 | $1,440 | $3,670 |
| 2013 | -- | $5,110 | $1,440 | $3,670 |
Source: Public Records
Map
Nearby Homes
- 638 English Oak Cir
- 109 Shingle Oak Dr
- 716 Bluff Oak Dr
- 112 Shingle Oak Dr
- 571 English Oak Cir
- 114 Shingle Oak Dr
- 714 Bluff Oak Dr
- 116 Shingle Oak Dr
- 118 Shingle Oak Dr
- 120 Shingle Oak Dr
- 204 Bear Oak Ct
- Wilmington Plan at Oakley Pointe
- Raleigh Plan at Oakley Pointe
- Ellerbe Plan at Oakley Pointe
- Drexel Plan at Oakley Pointe
- Cypress Plan at Oakley Pointe
- Davidson Plan at Oakley Pointe
- Avery Plan at Oakley Pointe
- 238 Silk Oak Dr
- 126 Shingle Oak Dr
- 900 Laurel Oak Ln
- 906 Laurel Oak Ln
- 621 English Oak Cir
- 908 Laurel Oak Ln
- 619 English Oak Cir
- 910 Laurel Oaks Ln
- 910 Laurel Oak Ln
- 617 English Oak Cir
- 624 English Oak Cir
- 622 English Oak Cir
- 631 English Oak Cir
- 905 Laurel Oak Ln
- 903 Laurel Oak Ln
- 907 Laural Oak Ln
- 620 English Oak Cir
- 626 English Oak Cir
- 912 Laurel Oak Ln
- 909 Laurel Oak Ln
- 615 English Oak Cir
- 628 English Oak Cir