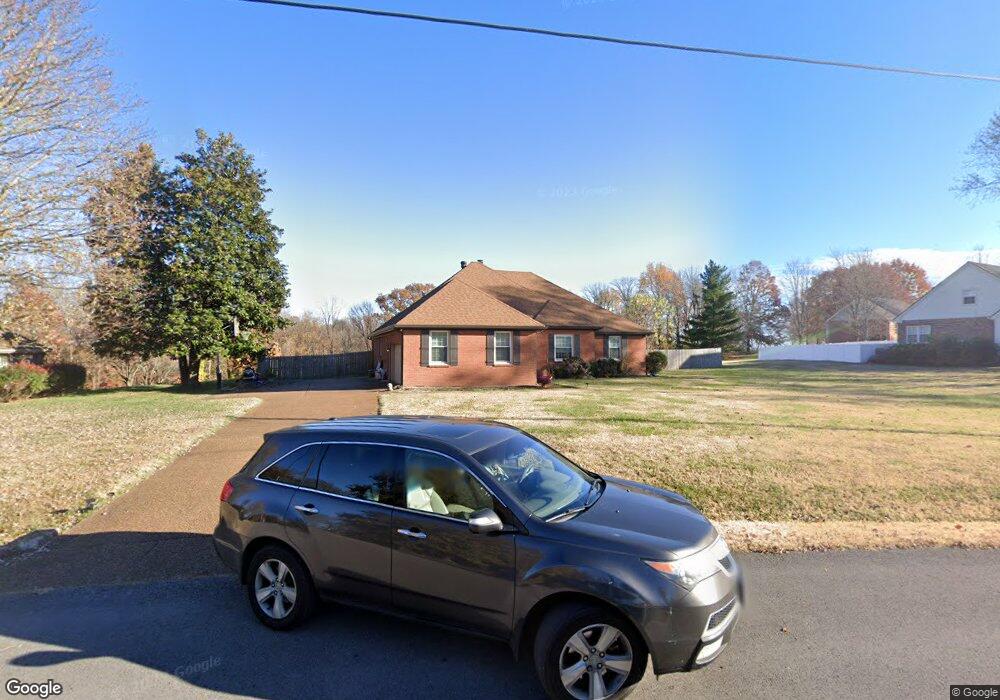
902 Lexie Ct Mount Juliet, TN 37122
Estimated Value: $441,723 - $601,000
--
Bed
2
Baths
2,111
Sq Ft
$258/Sq Ft
Est. Value
About This Home
This home is located at 902 Lexie Ct, Mount Juliet, TN 37122 and is currently estimated at $544,681, approximately $258 per square foot. 902 Lexie Ct is a home located in Wilson County with nearby schools including West Elementary School, West Wilson Middle School, and Mt. Juliet High School.
Ownership History
Date
Name
Owned For
Owner Type
Purchase Details
Closed on
May 22, 2007
Sold by
Roy Lori L
Bought by
Alan Sharp
Current Estimated Value
Home Financials for this Owner
Home Financials are based on the most recent Mortgage that was taken out on this home.
Original Mortgage
$195,484
Outstanding Balance
$122,624
Interest Rate
6.75%
Estimated Equity
$422,057
Purchase Details
Closed on
Jul 14, 2006
Sold by
Roy Nicholas F
Bought by
Roy Lori L
Purchase Details
Closed on
Jul 10, 2006
Sold by
Roy Nicholas F
Bought by
Roy Lori L
Purchase Details
Closed on
Apr 14, 1992
Bought by
Roy Nicholas F
Purchase Details
Closed on
Feb 17, 1988
Bought by
Poulson Terry L and Poulson Jean
Purchase Details
Closed on
Mar 6, 1987
Bought by
Butler Mary M
Purchase Details
Closed on
Apr 4, 1904
Bought by
Robinson Dean Tr
Create a Home Valuation Report for This Property
The Home Valuation Report is an in-depth analysis detailing your home's value as well as a comparison with similar homes in the area
Home Values in the Area
Average Home Value in this Area
Purchase History
| Date | Buyer | Sale Price | Title Company |
|---|---|---|---|
| Alan Sharp | $240,000 | -- | |
| Roy Lori L | -- | -- | |
| Roy Lori L | -- | -- | |
| Roy Nicholas F | $22,000 | -- | |
| Poulson Terry L | $17,000 | -- | |
| Butler Mary M | $21,800 | -- | |
| Robinson Dean Tr | -- | -- |
Source: Public Records
Mortgage History
| Date | Status | Borrower | Loan Amount |
|---|---|---|---|
| Open | Robinson Dean Tr | $195,484 | |
| Closed | Robinson Dean Tr | $48,867 |
Source: Public Records
Tax History Compared to Growth
Tax History
| Year | Tax Paid | Tax Assessment Tax Assessment Total Assessment is a certain percentage of the fair market value that is determined by local assessors to be the total taxable value of land and additions on the property. | Land | Improvement |
|---|---|---|---|---|
| 2024 | $1,515 | $79,350 | $18,750 | $60,600 |
| 2022 | $1,515 | $79,350 | $18,750 | $60,600 |
| 2021 | $1,515 | $79,350 | $18,750 | $60,600 |
| 2020 | $1,485 | $79,350 | $18,750 | $60,600 |
| 2019 | $1,485 | $58,950 | $15,625 | $43,325 |
| 2018 | $1,485 | $58,950 | $15,625 | $43,325 |
| 2017 | $1,485 | $58,950 | $15,625 | $43,325 |
| 2016 | $1,485 | $58,950 | $15,625 | $43,325 |
| 2015 | $1,515 | $58,950 | $15,625 | $43,325 |
| 2014 | $1,335 | $51,944 | $0 | $0 |
Source: Public Records
Map
Nearby Homes
- 905 Champions Cir
- 463 Wedge Way
- 907 Champions Cir
- 653 Terrace Hill Rd
- 9298 Lebanon Rd
- 0 Canterbury Trail
- Savoy Plan at Willow Landing
- Macon Plan at Willow Landing
- Meaghan Plan at Willow Landing
- Jordan Plan at Willow Landing
- Waterville Plan at Willow Landing
- Winters Plan at Willow Landing
- Cheyenne Plan at Willow Landing
- Hampstead Plan at Willow Landing
- 106 Emeline Way
- 110 Emeline Way
- 1126 Aster Place
- 1125 Aster Place
- 1127 Aster Place
- 600 Southshore Point
- 904 Lexie Ct
- 805 Lexie Ln
- 906 Lexie Ct
- 803 Lexie Ln
- 905 Lexie Ct
- 807 Lexie Ln
- 907 Lexie Ct
- 608 Cooks Hill Rd
- 808 Lexie Ln
- 804 Lexie Ln
- 802 Lexie Ln
- 806 Lexie Ln
- 610 Cooks Hill Rd
- 1288 Teddys Place
- 612 Cooks Hill Rd
- 1287 Teddys Place
- 1290 Teddys Place
- 703 Cooks Hill Ct
- 614 Cooks Hill Rd
- 604 Cooks Hill Rd