Estimated Value: $134,000 - $308,693
4
Beds
2
Baths
1,385
Sq Ft
$153/Sq Ft
Est. Value
About This Home
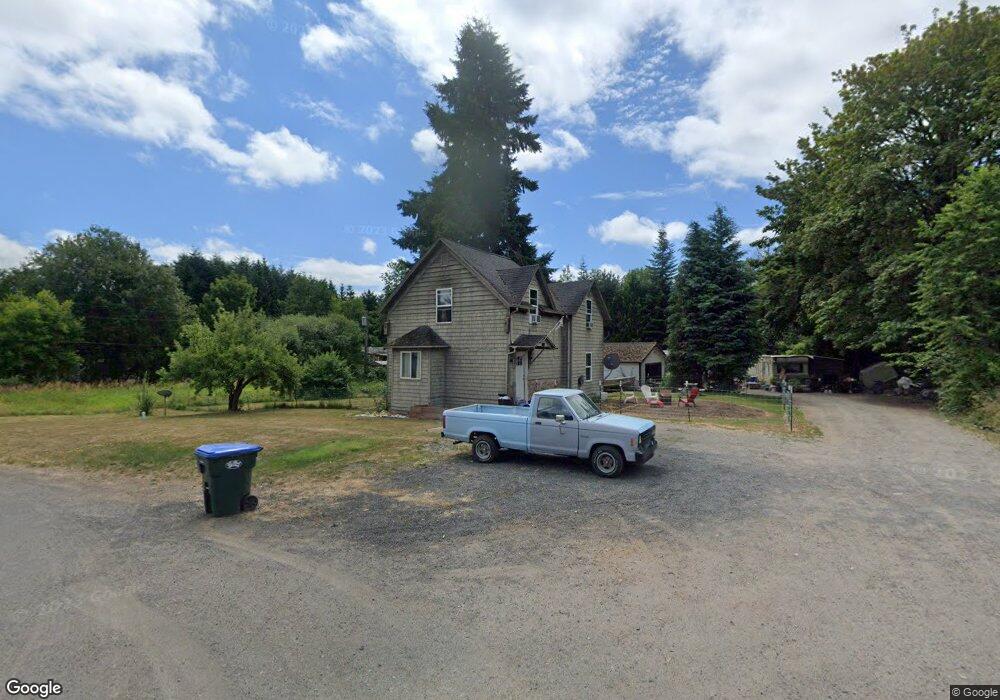
This home is located at 902 Main St, Vader, WA 98593 and is currently estimated at $212,173, approximately $153 per square foot. 902 Main St is a home located in Lewis County with nearby schools including Castle Rock Elementary School, Castle Rock Middle School, and Castle Rock High School.
Ownership History
Date
Name
Owned For
Owner Type
Purchase Details
Closed on
Nov 6, 2025
Sold by
Cunha Richard and Cunha Mallisa
Bought by
Summa Real Estate Llc
Current Estimated Value
Purchase Details
Closed on
Apr 1, 2019
Sold by
Gilmore Eldon J
Bought by
Cunha Richard and Cunha Mallisa
Home Financials for this Owner
Home Financials are based on the most recent Mortgage that was taken out on this home.
Original Mortgage
$117,156
Interest Rate
7%
Mortgage Type
Land Contract Argmt. Of Sale
Purchase Details
Closed on
Oct 11, 2016
Sold by
Gilmore Eldon J
Bought by
Clough Douglas J and Christy Bethany A
Create a Home Valuation Report for This Property
The Home Valuation Report is an in-depth analysis detailing your home's value as well as a comparison with similar homes in the area
Purchase History
| Date | Buyer | Sale Price | Title Company |
|---|---|---|---|
| Summa Real Estate Llc | $132,500 | Title Guaranty | |
| Cunha Richard | $133,500 | Title Guaranty | |
| Cunha Richard | $120,000 | None Available | |
| Clough Douglas J | $100,710 | None Available |
Source: Public Records
Mortgage History
| Date | Status | Borrower | Loan Amount |
|---|---|---|---|
| Previous Owner | Cunha Richard | $117,156 |
Source: Public Records
Tax History
| Year | Tax Paid | Tax Assessment Tax Assessment Total Assessment is a certain percentage of the fair market value that is determined by local assessors to be the total taxable value of land and additions on the property. | Land | Improvement |
|---|---|---|---|---|
| 2025 | $1,934 | $253,900 | $56,900 | $197,000 |
| 2024 | $1,934 | $247,700 | $50,700 | $197,000 |
| 2023 | $1,692 | $238,400 | $41,400 | $197,000 |
| 2022 | $1,638 | $197,600 | $32,600 | $165,000 |
| 2021 | $1,495 | $197,600 | $32,600 | $165,000 |
| 2020 | $1,448 | $164,700 | $28,500 | $136,200 |
| 2019 | $1,344 | $153,900 | $15,500 | $138,400 |
| 2018 | $614 | $140,700 | $14,200 | $126,500 |
| 2017 | $1,228 | $122,400 | $14,200 | $108,200 |
| 2016 | $1,134 | $112,600 | $14,200 | $98,400 |
| 2015 | $974 | $101,700 | $12,300 | $89,400 |
| 2013 | $974 | $82,600 | $28,300 | $54,300 |
Source: Public Records
Map
Nearby Homes
Your Personal Tour Guide
Ask me questions while you tour the home.