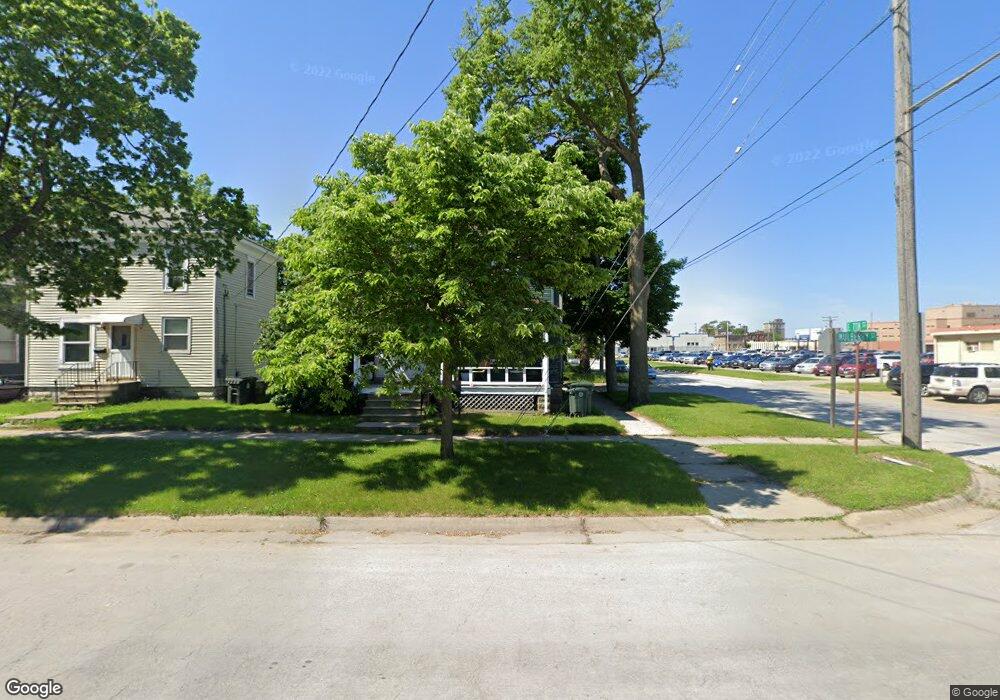
902 Mulberry St Waterloo, IA 50703
Cedar River NeighborhoodEstimated Value: $53,275 - $162,000
2
Beds
2
Baths
1,248
Sq Ft
$75/Sq Ft
Est. Value
About This Home
This home is located at 902 Mulberry St, Waterloo, IA 50703 and is currently estimated at $93,819, approximately $75 per square foot. 902 Mulberry St is a home located in Black Hawk County with nearby schools including Lowell Elementary School, Central Middle School, and West High School.
Ownership History
Date
Name
Owned For
Owner Type
Purchase Details
Closed on
Apr 22, 2024
Sold by
Jamieson John D and Jamieson Myrna K
Bought by
Qfi-B Holdings Llc
Current Estimated Value
Home Financials for this Owner
Home Financials are based on the most recent Mortgage that was taken out on this home.
Original Mortgage
$189,000
Outstanding Balance
$186,127
Interest Rate
6.79%
Mortgage Type
Seller Take Back
Estimated Equity
-$92,308
Create a Home Valuation Report for This Property
The Home Valuation Report is an in-depth analysis detailing your home's value as well as a comparison with similar homes in the area
Home Values in the Area
Average Home Value in this Area
Purchase History
| Date | Buyer | Sale Price | Title Company |
|---|---|---|---|
| Qfi-B Holdings Llc | $210,000 | Title Services |
Source: Public Records
Mortgage History
| Date | Status | Borrower | Loan Amount |
|---|---|---|---|
| Open | Qfi-B Holdings Llc | $189,000 |
Source: Public Records
Tax History
| Year | Tax Paid | Tax Assessment Tax Assessment Total Assessment is a certain percentage of the fair market value that is determined by local assessors to be the total taxable value of land and additions on the property. | Land | Improvement |
|---|---|---|---|---|
| 2025 | $572 | $28,690 | $3,580 | $25,110 |
| 2024 | $572 | $26,410 | $3,580 | $22,830 |
| 2023 | $512 | $26,410 | $3,580 | $22,830 |
| 2022 | $500 | $23,350 | $3,580 | $19,770 |
| 2021 | $442 | $23,350 | $3,580 | $19,770 |
| 2020 | $434 | $19,510 | $1,540 | $17,970 |
| 2019 | $434 | $19,510 | $1,540 | $17,970 |
| 2018 | $434 | $19,510 | $1,540 | $17,970 |
| 2017 | $434 | $19,510 | $1,540 | $17,970 |
| 2016 | $442 | $19,510 | $1,540 | $17,970 |
| 2015 | $442 | $19,510 | $1,540 | $17,970 |
| 2014 | $452 | $19,510 | $1,540 | $17,970 |
Source: Public Records
Map
Nearby Homes
- 911 Lafayette St Unit 913
- 213-223 E 5th St
- 1421 Mulberry St
- 400 Elm St
- 510 Courtland St
- 315 Walnut St
- 1612 Franklin St
- 337 Almond St
- 0 Bates St
- 73 Lafayette St
- 64 Franklin St
- 520 Linden Ave
- 56 Lafayette St
- 307 Oneida St
- 1002 Mobile St
- 218 Sumner St
- 324 Sumner St
- 519 W 9th St
- 823 Glenwood St
- 861 Grindstone Cir
- 908 Mulberry St
- 910 Mulberry St
- 901 Mulberry St
- 320 E 7th St
- 912 Mulberry St
- 316 E 7th St
- 905 Mulberry St
- 312 E 7th St
- 911 Mulberry St
- 918 Mulberry St
- 308 E 7th St
- 323 E 8th St
- 922 Mulberry St
- 319 E 8th St
- 325 E 8th St
- 927 Mulberry St
- 415 E 7th St
- 928 Mulberry St
- 911 Lafayette St Unit 913.5
- 917 Lafayette St
Your Personal Tour Guide
Ask me questions while you tour the home.