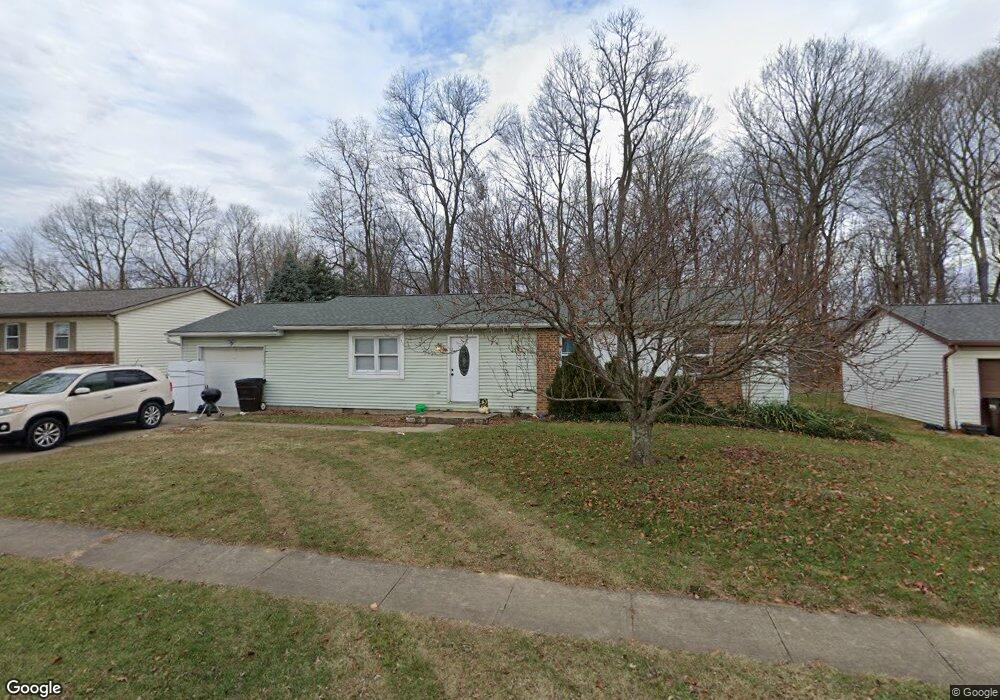
902 Preston Dr Waynesville, OH 45068
Wayne Township NeighborhoodEstimated Value: $208,000 - $263,000
3
Beds
1
Bath
1,200
Sq Ft
$201/Sq Ft
Est. Value
About This Home
This home is located at 902 Preston Dr, Waynesville, OH 45068 and is currently estimated at $241,704, approximately $201 per square foot. 902 Preston Dr is a home located in Warren County with nearby schools including Waynesville Elementary School, Waynesville Middle School, and Waynesville High School.
Ownership History
Date
Name
Owned For
Owner Type
Purchase Details
Closed on
Oct 5, 2004
Sold by
Deters Loretta L
Bought by
Perry Timothy W and Perry Julie D
Current Estimated Value
Home Financials for this Owner
Home Financials are based on the most recent Mortgage that was taken out on this home.
Original Mortgage
$78,400
Outstanding Balance
$39,735
Interest Rate
6.12%
Mortgage Type
Purchase Money Mortgage
Estimated Equity
$201,969
Purchase Details
Closed on
Nov 20, 1998
Sold by
Spencer Perry M
Bought by
Deters Loretta L
Home Financials for this Owner
Home Financials are based on the most recent Mortgage that was taken out on this home.
Original Mortgage
$90,375
Interest Rate
6.59%
Mortgage Type
New Conventional
Purchase Details
Closed on
Mar 29, 1985
Sold by
Ener-Ficient Homes
Bought by
Perry Spencer and Perry M.
Purchase Details
Closed on
Jan 18, 1985
Sold by
Third National Bank & Tru
Bought by
Ener-Ficient Homes
Purchase Details
Closed on
Jun 21, 1983
Sold by
Third National Bank & Tru
Bought by
Third National Bank & Tru
Create a Home Valuation Report for This Property
The Home Valuation Report is an in-depth analysis detailing your home's value as well as a comparison with similar homes in the area
Home Values in the Area
Average Home Value in this Area
Purchase History
| Date | Buyer | Sale Price | Title Company |
|---|---|---|---|
| Perry Timothy W | $98,000 | Title Resolutions | |
| Deters Loretta L | $90,000 | -- | |
| Perry Spencer | $47,500 | -- | |
| Ener-Ficient Homes | -- | -- | |
| Third National Bank & Tru | -- | -- |
Source: Public Records
Mortgage History
| Date | Status | Borrower | Loan Amount |
|---|---|---|---|
| Open | Perry Timothy W | $78,400 | |
| Closed | Deters Loretta L | $90,375 |
Source: Public Records
Tax History Compared to Growth
Tax History
| Year | Tax Paid | Tax Assessment Tax Assessment Total Assessment is a certain percentage of the fair market value that is determined by local assessors to be the total taxable value of land and additions on the property. | Land | Improvement |
|---|---|---|---|---|
| 2024 | $2,575 | $58,890 | $25,200 | $33,690 |
| 2023 | $2,158 | $42,822 | $12,915 | $29,907 |
| 2022 | $2,116 | $42,823 | $12,915 | $29,908 |
| 2021 | $2,038 | $42,823 | $12,915 | $29,908 |
| 2020 | $1,929 | $34,815 | $10,500 | $24,315 |
| 2019 | $1,930 | $34,815 | $10,500 | $24,315 |
| 2018 | $1,931 | $34,815 | $10,500 | $24,315 |
| 2017 | $1,898 | $31,948 | $9,765 | $22,183 |
| 2016 | $1,785 | $31,948 | $9,765 | $22,183 |
| 2015 | $1,788 | $31,948 | $9,765 | $22,183 |
| 2014 | $1,720 | $29,040 | $8,880 | $20,170 |
| 2013 | $1,717 | $34,350 | $10,500 | $23,850 |
Source: Public Records
Map
Nearby Homes
- 1198 Lytle Rd
- 1106 Lytle Rd
- 1036 Bayberry Dr
- 1106 Brookfield Dr Unit 1106
- 60 E Ellis Dr
- 363 Victoria Place
- 350 Somerset Ln
- 460 Miami St
- 53 S 4th St
- 437 N Main St
- 7219 N Route 42
- 7219 U S 42
- 1 Cumberland Ct
- 196 S 3rd St
- 155 S Main St
- 7219 N Us Rt 42
- 0 Ohio 73 Unit 944080
- 401 Wilkerson Ln
- 8519 Old Stage Rd
- 127 New Burlington Rd
- 892 Preston Dr
- 924 Preston Dr
- 897 Preston Dr
- 880 Preston Dr
- 946 Preston Dr
- 945 Preston Dr
- 789 Robindale Dr
- 864 Preston Dr
- 794 Robindale Dr
- 1350 Lytle Rd
- Lot #12 Lytle Rd
- Lot #11 Lytle Rd
- 1220 Lytle Rd
- 857 Preston Dr
- 769 Robindale Dr
- 1273 Lytle Rd
- 1261 Lytle Rd
- 1315 Lytle Rd
- 772 Robindale Dr
- 1253 Lytle Rd