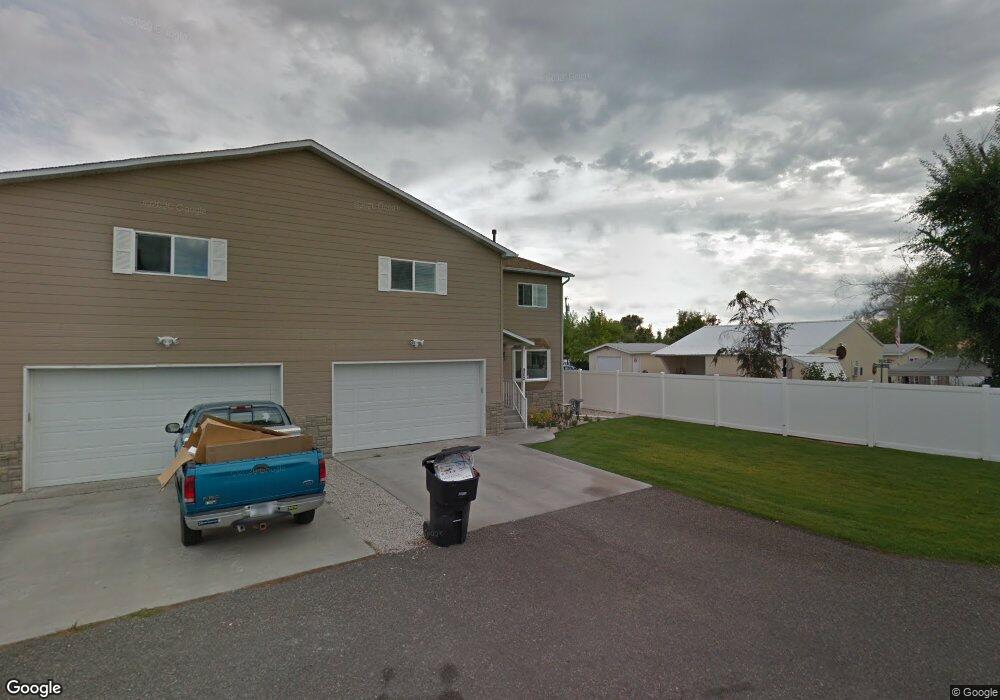
902 Rollman Way Billings, MT 59105
Billings Heights NeighborhoodEstimated Value: $345,000 - $398,000
3
Beds
3
Baths
3,858
Sq Ft
$95/Sq Ft
Est. Value
About This Home
This home is located at 902 Rollman Way, Billings, MT 59105 and is currently estimated at $366,364, approximately $94 per square foot. 902 Rollman Way is a home located in Yellowstone County with nearby schools including Bitterroot School, Medicine Crow Middle School, and Skyview High School.
Ownership History
Date
Name
Owned For
Owner Type
Purchase Details
Closed on
Apr 27, 2016
Sold by
Chad's Building Llc
Bought by
Rsj Holdings Llc
Current Estimated Value
Purchase Details
Closed on
Aug 7, 2015
Sold by
W K Design Llc
Bought by
Hta Enterprises Llc
Purchase Details
Closed on
May 18, 2015
Sold by
Henderson Betty A
Bought by
Pyburn Dain Alan and Ryburn Jennifer Lynn
Home Financials for this Owner
Home Financials are based on the most recent Mortgage that was taken out on this home.
Original Mortgage
$194,596
Interest Rate
3.25%
Mortgage Type
FHA
Purchase Details
Closed on
Oct 29, 2007
Sold by
Rollman Douglas W and Rollman Pamela A
Bought by
Henderson Betty A
Purchase Details
Closed on
Feb 3, 2005
Sold by
Rollman Douglas W
Bought by
Rollman Douglas W and Rollman Pamela A
Home Financials for this Owner
Home Financials are based on the most recent Mortgage that was taken out on this home.
Original Mortgage
$158,720
Interest Rate
8.15%
Mortgage Type
Adjustable Rate Mortgage/ARM
Create a Home Valuation Report for This Property
The Home Valuation Report is an in-depth analysis detailing your home's value as well as a comparison with similar homes in the area
Home Values in the Area
Average Home Value in this Area
Purchase History
We collect this data history from publicly available records. To have your information removed, we recommend requesting removal directly through your county’s website.
| Date | Buyer | Sale Price | Title Company |
|---|---|---|---|
| Rsj Holdings Llc | -- | First Montana Title | |
| Hta Enterprises Llc | -- | -- | |
| Koelzer Mary W | -- | -- | |
| Koelzer Thomas C | -- | -- | |
| Koelzer Thomas C | -- | -- | |
| Pyburn Dain Alan | -- | St | |
| Henderson Betty A | -- | None Available | |
| Rollman Douglas W | -- | St |
Source: Public Records
Mortgage History
We collect this data history from publicly available records. To have your information removed, we recommend requesting removal directly through your county’s website.
| Date | Status | Borrower | Loan Amount |
|---|---|---|---|
| Previous Owner | Pyburn Dain Alan | $194,596 | |
| Previous Owner | Rollman Douglas W | $158,720 |
Source: Public Records
Tax History
| Year | Tax Paid | Tax Assessment Tax Assessment Total Assessment is a certain percentage of the fair market value that is determined by local assessors to be the total taxable value of land and additions on the property. | Land | Improvement |
|---|---|---|---|---|
| 2025 | $3,519 | $391,600 | $31,880 | $359,720 |
| 2024 | $3,519 | $372,800 | $18,931 | $353,869 |
| 2023 | $3,506 | $372,800 | $18,931 | $353,869 |
| 2022 | $3,070 | $286,100 | $0 | $0 |
| 2021 | $2,920 | $286,100 | $0 | $0 |
| 2020 | $2,674 | $248,600 | $0 | $0 |
| 2019 | $2,550 | $248,600 | $0 | $0 |
| 2018 | $2,543 | $243,800 | $0 | $0 |
| 2017 | $2,470 | $243,800 | $0 | $0 |
| 2016 | $2,312 | $230,500 | $0 | $0 |
| 2015 | $1,580 | $222,900 | $0 | $0 |
| 2014 | $1,222 | $141,587 | $0 | $0 |
Source: Public Records
Map
Nearby Homes
- 903 Lynch Dr Unit 10
- 737 Lambrecht Ln
- 1732 Hesperia St
- 1707 Hesperia St
- 1525 Bench Blvd Unit 29
- 819 Kingston Ave
- 1210 Maurine St
- 901 Kale Dr
- 1312 Maurine St
- 1125 Competition Ave
- 1247 Wicks Ln
- 709 Anchor Ave Unit 1-7
- TBD U S 87
- 918 Ahoy Ave
- 1346 Janie St
- 1982 Sandra Dr
- 427 Kathy Ln
- 733 Logan Ln
- 1226 Cottonwood Blvd Unit 10
- 1226 Cottonwood Blvd Unit 8
Your Personal Tour Guide
Ask me questions while you tour the home.